
Chart patterns are commonly used in technical analysis to take advantage of the repetitive nature of price movements. A cup and handle pattern happens when a currency pair’s price drops, then stages a rally that hits the previous swing high. This pattern may happen after an initial uptrend or after a sustained downtrend. When it happens after an uptrend, it signifies the continuation of the trend. When it is preceded by a downtrend, it signifies an impending bullish reversal.
The logic behind this pattern is that if prices attempted a downtrend, then failed, and there must be high buying pressure to drive the price even higher than the previous swing high.
How to identify the pattern
This pattern can manifest in all chart timeframes, from a one-minute chart to the monthly chart. It forms when prices decline, stabilize, then form an uptrend that more or less equals the size of the preceding downtrend. This creates a cup shape resembling the letter U. The cup’s handle is formed when prices have a short consolidation period after the bull run that may resemble a flag or a pennant.
Ideally, the handle should be much smaller than the cup. In fact, it should only cover the upper third of the cup. If this handle stretches beyond the halfway point of the cup’s height, you should deem this pattern invalid.
For instance, assuming the cup forms between $1.00 to $2.00, the handle should not cross below $1.50. In an ideal situation, the handle should oscillate above $1.65. If the handle goes so far as to cancel out the majority of the gains from the cup, then the pattern is deemed invalid.

Figure 1: Cup and handle formation on a EURUSD daily chart.
The figure above shows a cup and handle pattern on a EURUSD daily chart. From the figure, we see that the formation was a continuation pattern as it was immediately preceded by an uptrend. The right wall of the cup was slightly higher than the left, after which prices consolidated for a short while to form the handle. A few days later, prices broke out upwards to form a significant bull run.
How to generate entry signals
There are two ways to obtain entry signals from this chart formation. First, you will need to wait for the handle to form. After this, you may wait for prices to close above the swing high of the cup, which gives the entry signal. Alternatively, you could wait for the price to close above the handle’s highest swing high, which yields the entry signal for a long trade.
From figure 1, after price consolidated to form the handle, we can see prices stage a breakout when they crossed above $1.1400, the cup’s swing high. This point was the entry signal.
However, the price will not always rise after staging this pattern. In rare cases, prices will produce a false breakout, then consolidate further or breakout from the handle downwards. For this reason, you should always employ a stop loss when trading this pattern.
Placing a stop loss
A stop loss order is a risk management technique. It is meant to close your long trade if prices stage a downward breakout instead of breaking out upwards after a cup and handle pattern. This prevents you from making further losses once the pattern is invalidated.
The best place to position your stop loss is just below the lowest swing low of the handle. If you are a more conservative risk-taker, you can position your stop loss order just below the last swing low of the handle.
Now, you may remember we established that the handle should never cross below the bottom half of the cup. Therefore, an ideal stop loss should never fall in this bottom half region. The closer your stop loss is to the top of the cup, the better your risk to reward ratio tends to become.
Setting a take profit level
For your take profit, measure the height of the cup. Using this height and the breakout point as your starting point, measure it upwards to obtain the take profit level. If the cup has different heights, you may use the lower height as a conservative take profit level. A higher height may be used if your strategy is more aggressive.
Alternatively, you may use the Fibonacci extension indicator. To do this, draw the Fib extension from the cup’s lowest swing low to the high on the cup’s right-hand side. Then, connect the indicator to the lowest swing low of the handle. The 1.0 level gives the take profit level.
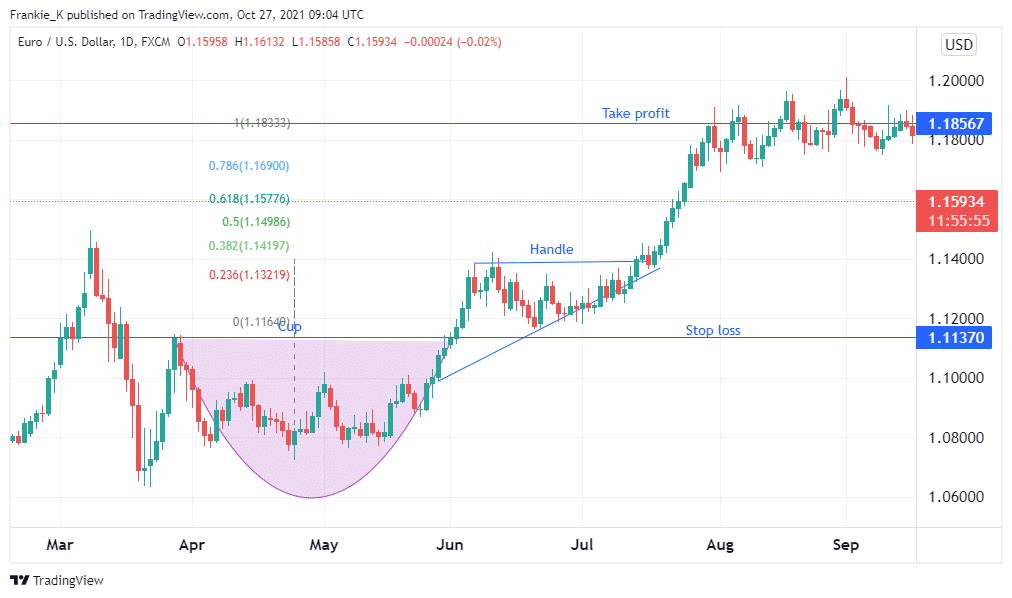
Figure 2: Cup and handle pattern showing take profit and stop loss levels.
The figure above is an example of the cup and handle pattern in a daily EURUSD chart. The chart shows the take profit level using a Fibonacci extension and a stop loss placed below the handle low.
In a nutshell
The cup and handle pattern is a continuation or reversal pattern. When a downtrend precedes it, it signifies an incoming bullish reversal. When preceded by an uptrend, it signifies the continuation of the uptrend. Patterns that form after an uptrend have the benefit of carrying on with the overall market trend. When the pattern follows a bear run, look for signs of declining seller momentum to increase the chances of the pattern’s validity.
Usually, the cup manifests as a downtrend, followed by a short consolidation at the bottom of the cup. Prices then trend upwards to approximately equal the height of the downtrend. The handle is formed as prices consolidate for a short while after climbing the height of the cup. More often than not, prices will break out from the handle in an upward direction. The cup may form a V shape at the bottom or a more rounded shape resembling the letter U.


