Technical analysis refers to the study of charts to predict the future price of an asset. It also involves using technical indicators like the moving average and the relative strength index (RSI), and tools like the Fibonacci retracement and Andrews Pitchfork to predict the price.
Technical analysis can be done in all types of assets, including forex, commodities, indices, and shares. In this article, we will look at a simple approach that will help you master the concept of technical analysis in three months or less.
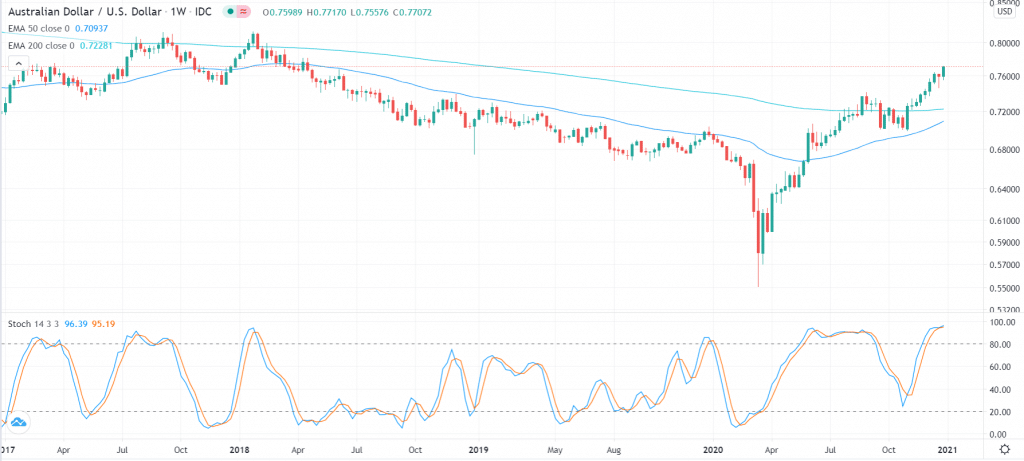
AUD/USD chart with moving averages and the stochastic oscillator
Identify your trading style
The first step you need to take when learning more about technical analysis is to identify your trading style. Fortunately, this is a relatively easy process to follow since it depends on your risk appetite and the reason why you want to become a trader.
You can be a scalper, meaning that your goal is to open tens of trades every day and eke a small profit on each of them. You can also be a swing trader who opens and exits trades within a few days. Further, you can be a position trader who opens and holds trades for several weeks.
You will use a different type of technical analysis in each of these strategies. Therefore, you need to examine the type of trader that you are before you start diving into technical analysis.
Read briefly about technical analysis
Fortunately, there are many resources out there about technical analysis. There are many free websites like babypips.com and dailyfx.com that have vast free resources about how it works. There are also many books and YouTube videos about the different concepts of analysis.
As you start, we recommend that you just take time to read briefly about these. Don’t spend a lot of time on these resources at first. The goal of doing this is to introduce or get you acquainted to the concept.
As you do this, you should write down some of the important concepts that you find in the materials. For example, you could write the types of indicators, types of technical analysis, and the strategy that most people use.
Use a demo account to test the indicators
The next step is to create a demo account and download the trading software. For starters, a demo, also known as a practice account, is a free account that allows you to test-drive the market. It has all the features, including live prices of the market, with the only difference being the money is fake.
You can easily create the demo account in the default MetaTrader 4 and 5 platforms. However, we recommend that you create one using your preferred broker. Doing this will give you access to all assets that the broker offers. Also, you should ensure that your demo account has the same amount that you intend to start with.
If this is your first time on the MT4/5, we recommend that you spend a substantial amount of time learning how it works. Learn more about the key features and tools that are available.
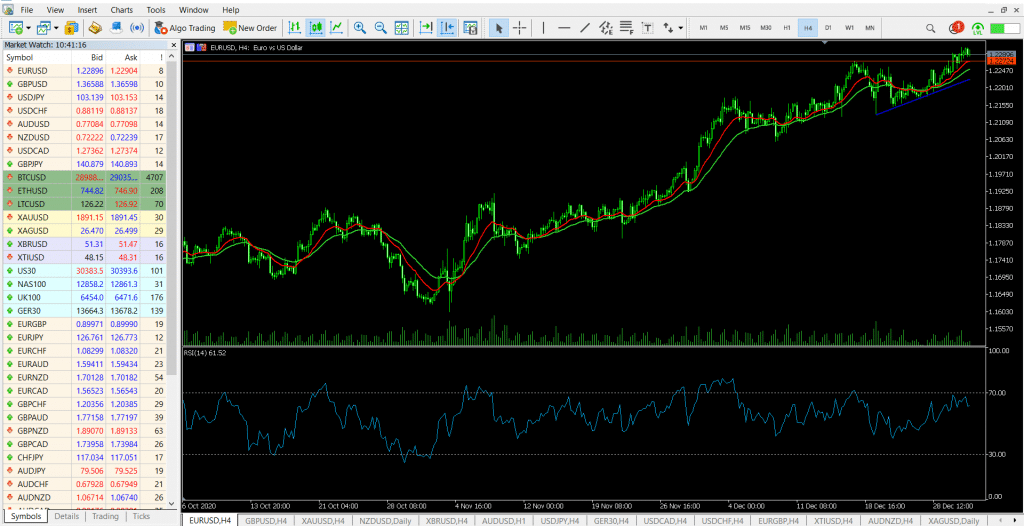
For a starter, the most important features of the MT4/5 platform are Marketwatch, charts, indicators, chart patterns, and the trading portal. Before you start your technical analysis journey, spend a few days playing with the demo account. The chart below shows a chart on MT5.
MT5 chart
Start with a few indicators
A common mistake many people make in forex trading is to use tens of technical indicators and tools in their analysis. That is wrong. Indeed, most successful day traders only use a maximum of two or three technical indicators. Personally, in most trading sessions, I use about three indicators in my decision-making process.
In simple, try and find indicators that meet your trading strategy. For example, some indicators like the accumulation and distribution and on-balance volume are only useful for people with a long horizon.
After you identify an indicator, take as much time as possible to learn more about it. For example, if you want to use the moving average, find all the best resources about moving averages. You can find books, websites, and online courses. Also, you should use YouTube to find traders who use the indicator.
As you do this, you will find that traders use the indicators differently. For example, there are those who buy a financial asset when the Relative Strength Index (RSI) is at the oversold level. Similarly, there are those who short it when it moves to the oversold level.
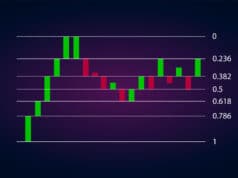
You should then repeat this on the other important indicators that you find. Also, you should repeat this education in approaching the various tools used in technical analysis like the Andrews Pitchfork, Fibonacci, and Gann Square.
Fine-tune your strategy
The final stage in your technical analysis training journey is to fine-tune your strategy and what you have learned in the previous stage. In this, you should go back to the demo account and try to use these skills to initiate and implement trades.
In fact, this is one of the best things that you can do since it will test your knowledge of the technical analysis. We recommend that you start with the amount of money that you will start your day trading with and see how it goes.
If you are doing this full-time, you should spend at least two months in a demo account to perfect the analysis.
Final thoughts
Technical analysis is an important process that all day traders should be acquainted with. It is often seen as a difficult thing to do. Still, we believe that you can do it in less than three months. It is also a life-long journey since you will often want to try other technical analysis skills. Further, you should commit to learning more about the analysis. Some of the books that we recommend are Volume analysis by Anna Couling, Beyond Candlesticks by Steve Nison, and Technical analysis by John Murphy.


