In the Middle Ages, an Italian named Leonardo Bonacci or Fibonacci was considered the most talented mathematician.
He created the Fibonacci sequence, a succession of figures where each number is the sum of the preceding two, e.g., 1, 1, 2, 3, 5, 8, 13, etc. Without being too mathematical, a ‘golden ratio’ exists within this series where each figure is approximately 1.618 times greater than the one before.
The ‘divine proportion’ (another term for the golden ratio) is quite divine indeed. It explains many of nature’s designs, such as those in flower petals, tree branches, snail shells, atoms, spiral galaxies, hurricanes, and much more.
Interestingly, if you measured the distance between your head and feet and divided it by the length from your navel to your feet, you should arrive somewhere close to 1.618.
These discoveries have led to several Fibonacci tools (let’s call it Fib from now on), showing that the divine proportion is unavoidable even in the financial markets. Hence, Fib has become a staple amongst all experience levels of technical analysts.
Fib retracements
Fib retracements are easily the most widely used Fib indicators due to their relative simplicity and versatility.
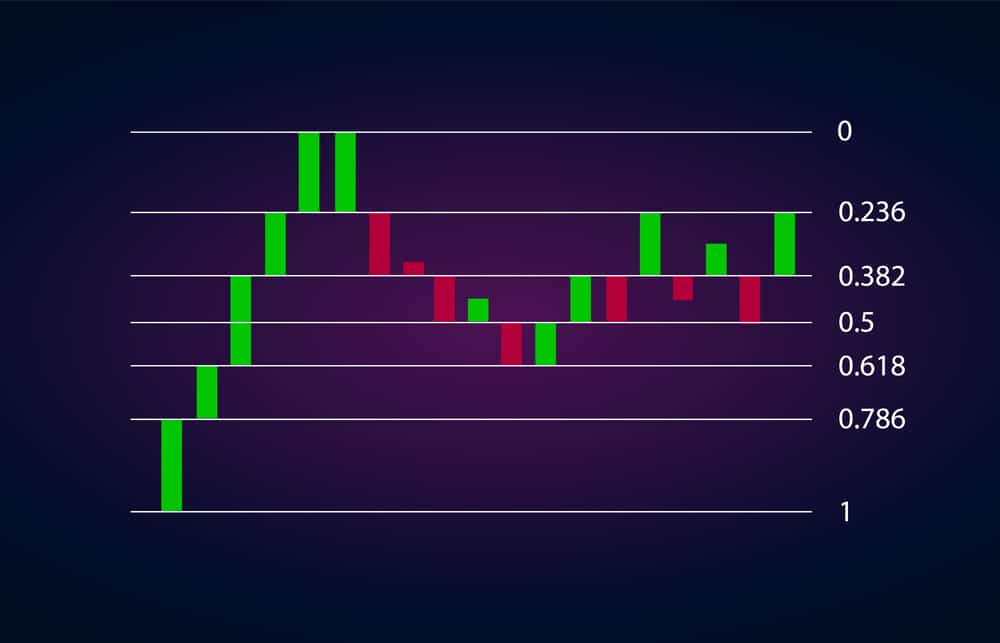
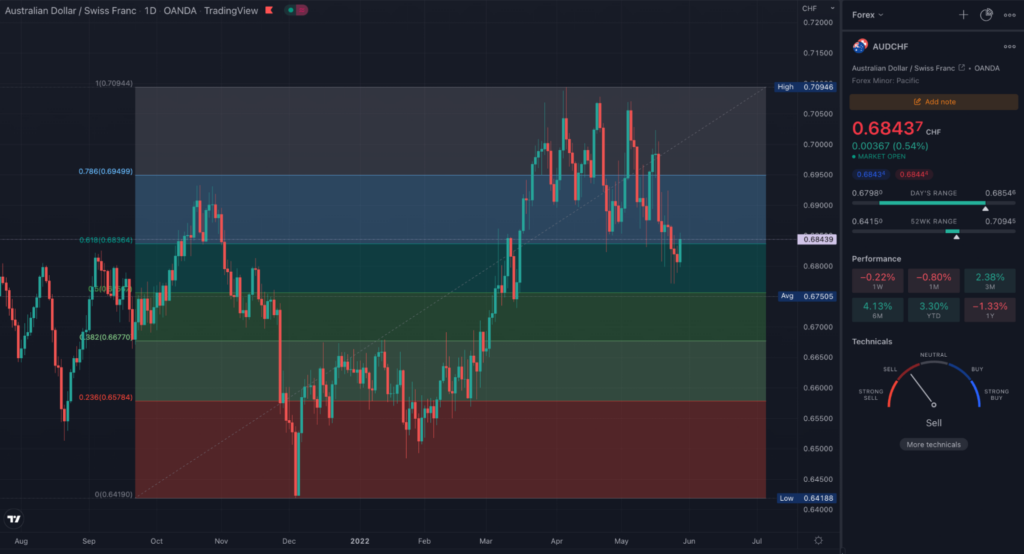
The retracement tool is based on other numerical proportions found in the Fibonacci series, namely 0.236 (or 23.6%), 0.382 (or 38.2%), 0.5 (or 50%), 0.786 (or 78.6%) and 1 (100%). This indicator simply draws these as horizontal lines that traders view as potential support and resistance levels from two anchor swing highs/lows.
The price of any market will almost certainly retrace to either of these ratios, resulting in some general assumptions that many traders observe. For instance, in a strong rally where the price is moving fast, the market will typically retrace somewhere between 38.2 and 50%.
However, in some cases, you may experience a deeper pullback to the 61.8% or 78.6% levels, which could offer opportunities for entering with a much smaller stop. In fact, many traders only consider an entry once the market has corrected itself deeply towards or just beyond the 78.6% area.
Nonetheless, the retracement tool is highly beneficial and is typically the only Fib tool used by traders.
Fib extensions
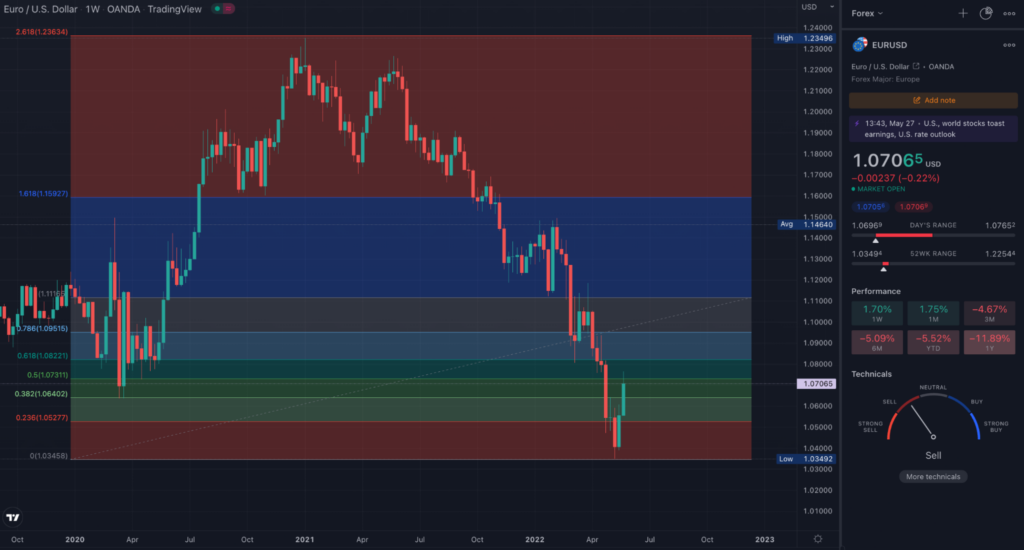
Fib extensions are an expansion of Fib retracements. While the latter measures the likely area for price to retrace, the Fib extension tool shows the most probable profit targets, assuming price has moved through all Fib levels in a move.
Unlike Fib retracements, extensions are primarily based on multiples of the 61.8% and 100 zones, i.e., 161.8%, 200%, 261.8%, and so on. A trader would first plot the ordinary retracement indicator and then apply the extensions to see where the price may head following a pullback.
These areas would essentially be where one may consider taking profits or setting their targets and can represent future levels of support and resistance.
Fib arcs
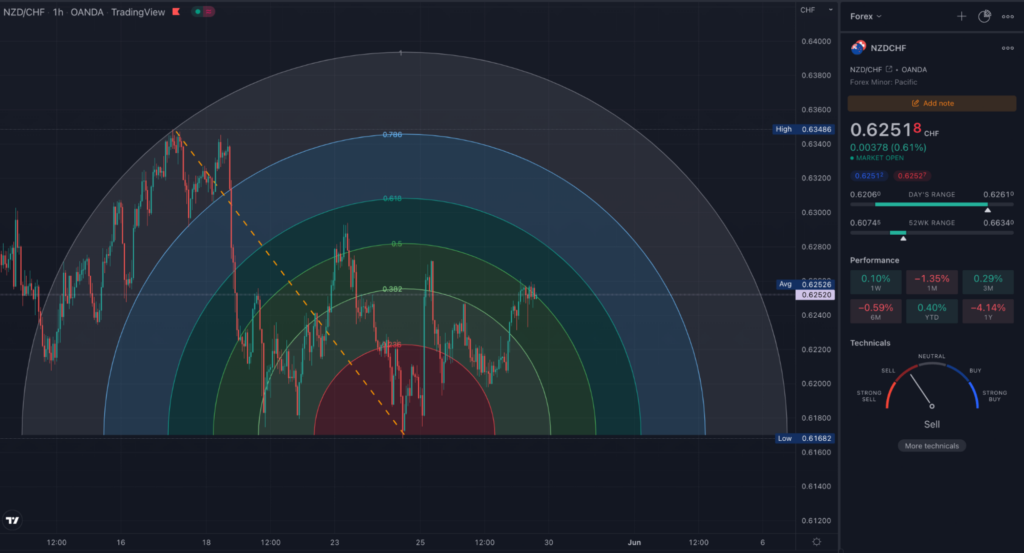
Arcs are one of the less frequently used indicators in Fibonacci but are more dynamic than the retracements. These are half concentrical circles that span from the connection of a swing high and low (called the baseline). The arcs intersect this trend line at typical Fib ratios.
Arcs are pretty similar to retracements and extensions in that they project future support and resistance areas. However, unlike their counterparts which only account for the magnitude of moves, arcs also factor in time.
The arc will always be at a marginally different price as it moves through each passing period. In simpler terms, what arcs do is simply follow or trace the market’s trajectory as closely as possible after it finds support or resistance at a certain Fib level.
Contrastingly, the retracement tool only shows fixed points where the price may retrace without accounting for the future path.
Fib time zones
Time zones are time-based vertical lines signifying future areas where a swing high or low could occur. These are also not so popular among forex traders as they are even more abstract.
It’s crucial to first understand the Fibonacci sequence, which is 1, 1, 2, 3, 5, 8, 13, 21, 34, 55, 89, 144, etc. Like other Fib tools, you plot the time zones from a swing from high to low (or in reverse). The time zones will then extend on the right side of the chart with corresponding numbers based on the Fib sequence.
Each figure in the series represents days. For example, the sixth time zone (8) would mirror eight days. So, when plotted on a chart, traders would expect a swing high or low at this zone eight days from the starting point.
Fib fans
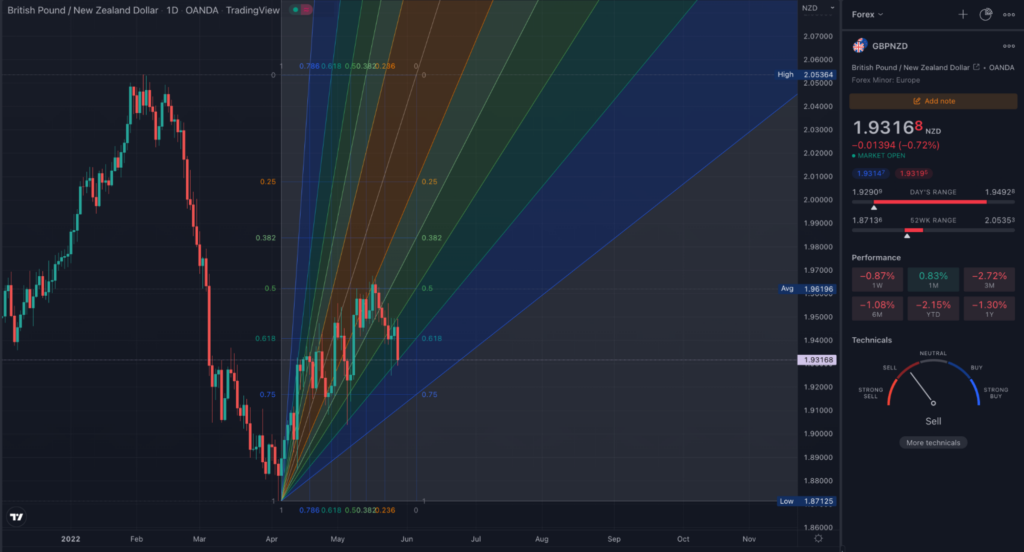
Fibonacci fans serve the same purpose as arcs. However, they are plotted as sequential trendlines rather than half circles. As with most tools, you draw the fan between two points resulting in the archetypal retracement ratios.
The Fib fans project future support and resistance levels more dynamically than retracements/extensions as, like arcs, they are both price and time-based.
Curtain thoughts
Ultimately, the most commonly used Fib tools remain the retracements and extensions. Of course, you are always free to experiment with the other ones as well. However, as with any indicator, Fibonacci can never be the be-all and end-all of trading.
Many forex communities are divided about the correct methods of plotting Fib on their charts and their true predictive power, leading to a great deal of subjectivity.
While based on more than a hundred-year-old theory, markets will frequently invalidate Fibonacci levels. Therefore, you should use these tools as confirmation and not the sole reason to enter a position.


