
Chart patterns are very popular with price action and trend traders. This is because they are highly effective and when you spot them, you stand to make a lot of money. Forex chart patterns are formed on the basis of underlying pressure from buyers and sellers.
There are two main types of chart patterns
1: Continuation patterns
Continuation patterns move in the original direction of the trend. They push the price to new highs if it was in an uptrend or new lows if the trend was bearish.
The main continuation patterns include pennants, rectangles and corrective wedges.
2: Reversal patterns
Reversal patterns mostly occur at the end of a trend. They signal that the primary trend is about to change direction. For example, if a reversal pattern occurs at the point of exhaustion in a bull market, the cue is a bearish trend is about to occur.
Reversal patterns include; Head & Shoulder pattern, double/ triple tops and bottoms, reversal wedges and ascending/ descending triangles.
Bullish & Bearish Chart Patterns
A) Pennants
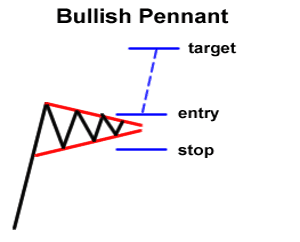
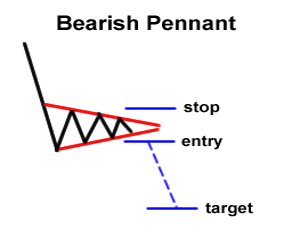
Pennants mainly occur during trends and consolidating price movements. They appear similar to symmetrical triangles but pennants occur on short term periods while symmetrical triangles appear in the long market moves.
Pennants are mainly frequent after quick and big moves since this is where traders book the small short term profits.
Once you’ve opened a position, place the stop loss slightly above the level of the trend line in the opposite direction. Pennants have been considered one of the most profitable chart patterns several times.
B) Rectangles
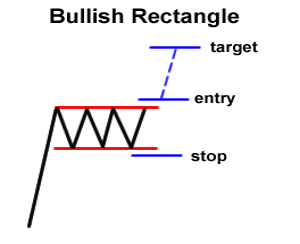
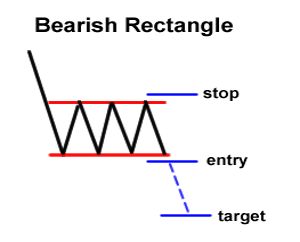
They are continuation patterns meaning rectangles mainly occur in the same direction of the trend. Big price moves occur once the price breaks out of the horizontal support and resistance lines (consolidation)
Rectangle patterns occur when price moves in a range. Once the breakout happens then a trader knows which direction the trend goes. Range traders who trade this pattern buy at support and sell at resistance.
Triangle Chart Patterns
A) Ascending/descending triangles
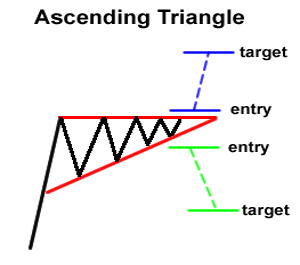
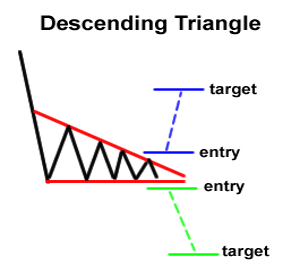
In ascending triangles, the top part is usually flat and the lower part has an upward slant while in descending triangles, the top part has a downward slant while the bottom is flat.
Once price breaks out of the channel there’s increased volume since the buyers are dumping the high prices and more sellers are in the market – in the case of descending triangles.
Open a position only when price breaks out of the channel. Place the stop loss slightly above the level of the opposite side.
B) Symmetrical triangle
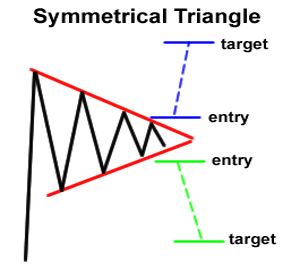
Symmetrical triangles show the indecision in the market. Those are areas where buyers and sellers have converged and the future of the trend is in question.
In such areas where the price moves in the same formation, wait for the channel to break in uptrend or downtrend. Once the trend has been determined, open a position after the neckline and place a stop loss on the opposite side of the channel.
Wedge Patterns
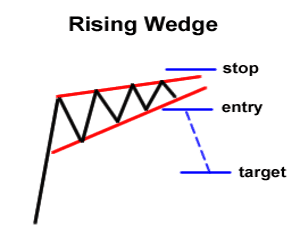
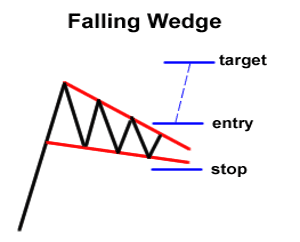
Wedges can be corrective (continuation) or reversal patterns.
In continuation, rising wedges are formed when the price closes with higher highs and higher lows. Falling wedges appear when the price closes with lower lows and even lower highs.
In reversal patterns, rising wedges reverse the bullish trends. While they may appear similar, the difference is where they are formed in relation to the trend. Reversal wedges appear once the primary trend is exhausted to signal the price change in the opposite direction, while continuation wedges mainly occur during the trend.
Head & Shoulders Patterns
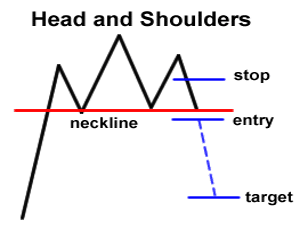
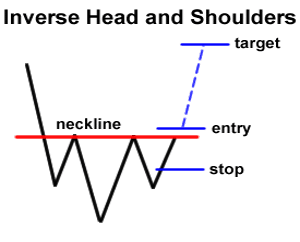
This is one of the most effective chart patterns, especially in larger time frames.
The head and shoulders appear after a bullish run has completed and a bearish pattern is being formed. The buyers have rallied until completely exhausted then the sellers take control.
The inverse head and shoulders pattern appears after a bearish market has finished and a bullish trend has just begun.
In both, there’s always increased volume after the breakout. Always wait until the pattern is completely formed and has broken the neckline before opening a trade.
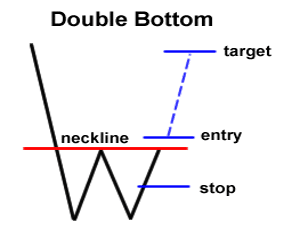
Double tops and bottoms
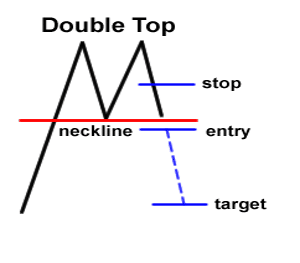
Double tops occur once the price has consolidated after a bull market but has failed to break out and proceed in the same direction. Due to this, the bears take over and trend changes.
As the name suggests, a pattern can only be double top if the formation has two tops around the resistance zones and two bottoms around the support zone.
In double bottoms, the price has consolidated after a bear market hence the bulls take over and change the trend. The pattern is only valid if the two bottoms have formed and the price has broken the neckline.


 and make a thorough analysis of five most profitable chart patterns.)