
The Donchian Channels indicator is a popular tool for determining the volatility of market prices. The channels widen during periods of high price volatility but close during periods of more stable pricing. Standard trading settings involve 20-periods with Donchian Channels, but this can be changed to suit your personal trading style.
Generally, the Donchian channel monitors the high and low of a previously set range, which is usually the last 20 days.
Futures, cryptocurrency, and other trending instruments all function nicely with this indicator. It is also capable of working well throughout a wide range of timeframes.
Reading the Donchian Channel
Trading with the Donchian system is straightforward. Below are two things that you should be aware of before moving on.
The first step is to have a look at the chart. It could be a chart showing the price trend of a commodity, cryptocurrency, currency pair, or other traded assets. Analyzing the graph’s pattern will reveal if the Donchian Channel is most appropriate for use in this instance.
The channel is most effective when the asset is trending and not consolidating. The indicator may not be accurate if utilized in a consolidating asset.
The second thing you should do is adjust the time frame. The default period is normally 20. However, you can alter it in accordance with your trading approach.
Trading strategies
It’s possible to find out how two prices relate to one another over time by bringing them together. Thus, three price values are plotted on the chart to provide you with a visual representation of its development. This will tell us whether the trend is bullish or bearish.
For this reason, it may be said that a Donchian Channel indicator seeks to connect current prices with trading ranges throughout the course of a specified time period.
In the charts, three calculated data points provide a visual map showing price changes throughout the specified time periods:
- By displaying how far the price has risen, the upper band indicates the strength of the bulls.
- By showing you the lowest price level that a bull-bear tag battle produced, the bottom band clearly depicts bear power.
- A different story is told when you look at the centerline. It shows the price range between the highs and lows.
Also, look for the upper and higher lines flattening down when a trend develops. When the curve flattens, it usually means that the trend is about to reverse. Price movement above or below the centerline usually confirms a reversal.
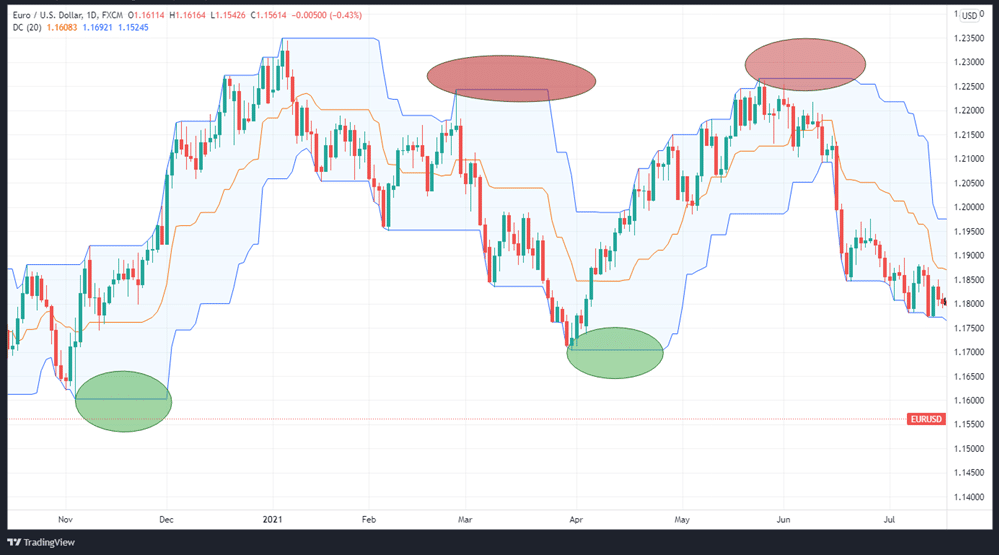
In the EURUSD chart above, the areas highlighted in green show flattening before an uptrend, while those in red show flattening before the downtrend.
An indicator of a breakout
There is a straightforward way to gauge a breakout by looking at the lowest low and highest high of the chart. Traders can utilize Donchian channels to identify a price breakout, which can then be used to determine whether to go long or short the currency pair.
For assets trading above the channel, traders can go longfrequently occurs and book profits, or they can go short if the stock is below it.
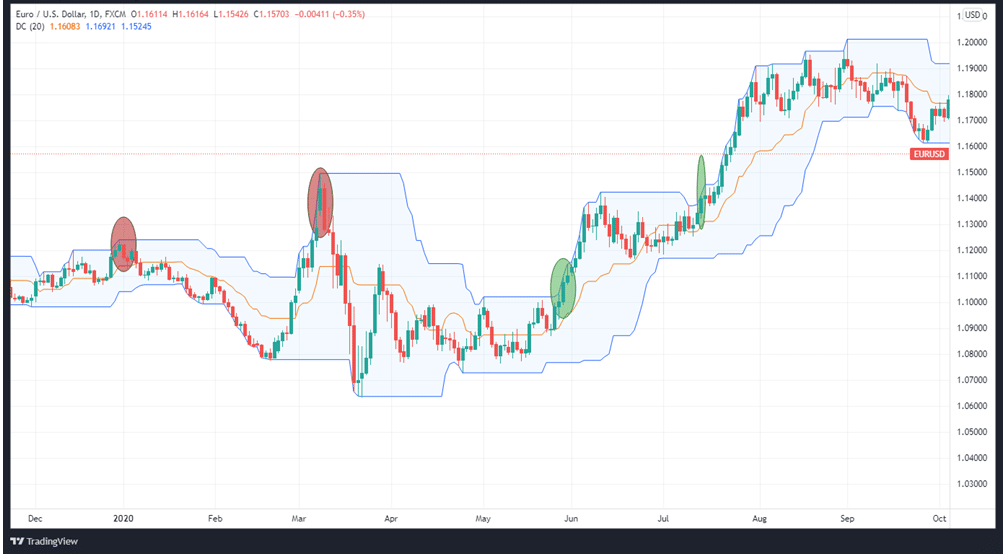
In the EURUSD chart above, we can see the entry candles for sell (highlighted in red) and buy (highlighted in green).
Taking cues from the middle band
The middle band is the average position of the price, based on the margin between the upper and lower band. Another usage for this band is as a breakout signal.
The middle band can be traded in trend following when employing Donchian channels. It’s a straightforward concept. With prices rising, the pricing band’s middle line should remain above it. The price will begin to decline if it breaks down below this support line.
It’s time to exit the market if the price is decreasing and it crosses the middle line. On the EURUSD chart below, the long trades are shown by candles highlighted in green above the middle line.
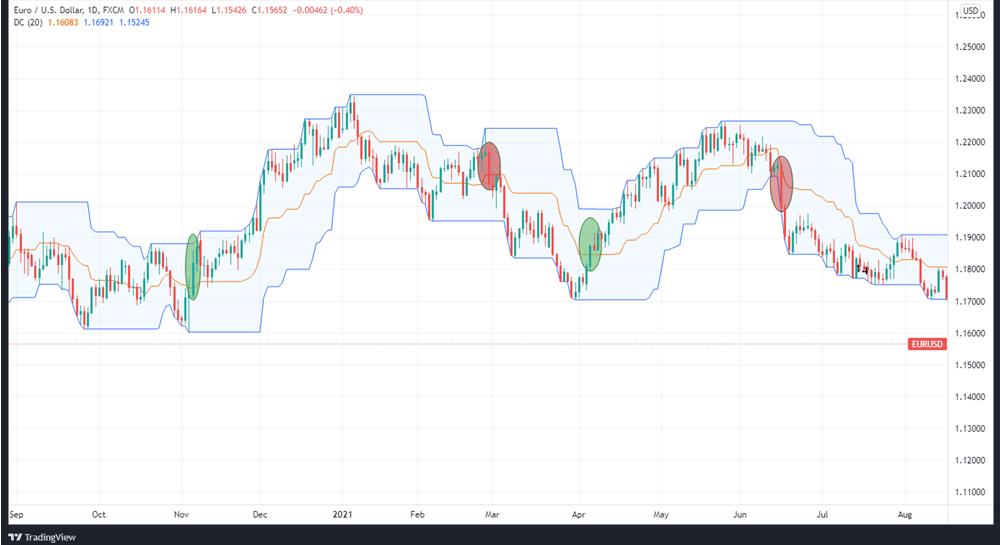
The short trade is shown by the candles highlighted in red below the middle line.
The following is a general guideline on how to respond to various signals:
- Place a buy order as soon as the bullish candle rises above the middle line.
- Short positions are opened when the bearish candle falls below the centerline, indicating a buying opportunity.
- When the candlesticks are developing above the middle line while the channel is headed upward, the market is in an uptrend.
- When the candlesticks are below the middle line while the channel heads downward, the market is in a downtrend.
In summary
In order to identify whether the market is overbought or oversold, the Donchian Channels indicator looks at price volatility. It’s worth noting that it performs best when used during a well-defined trend and not in ranging markets.
During a bullish or bearish trend, the price moves into the overbought or oversold zones, indicating a strengthening trend. This is a very strong signal, especially if it occurs frequently throughout the trend. To maximize your gains, you must be certain of the overall trend.


