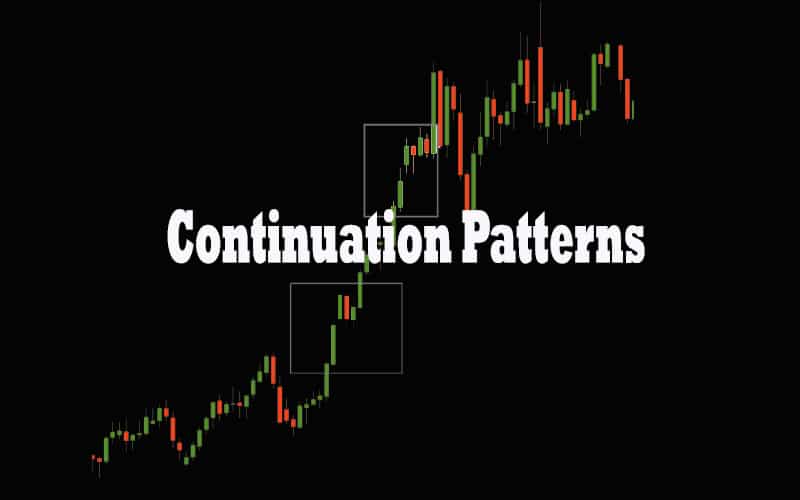
Continuation patterns are widely used chart patterns in technical analysis of the capital markets. Technical analysts, as well as forex robots, leverage these patterns to squeeze profits while trend trading, scalping, or news trading.
Continuation candlestick patterns differ from other chart patterns as they indicate price will continue to move in the direction of the underlying trend after consolidation. Such patterns are most reliable when the underlying trend is strong.
There are two types of continuation patterns. Bullish continuation patterns that indicate an uptrend would likely resume after consolidation or pullback. Bearish continuation patterns, on the other hand, indicate that a bearish trend is likely to continue after consolidation after a bounce back.
Below are some of the most popular continuation patterns for automated trading or manual trading.
Uptrend Continuation Patterns
Upside Tasuki Gap
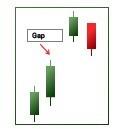
The Upside Tasuki Gap is a common bullish continuation candlestick pattern synonymous with trending markets. The moneymaking hack pattern is especially useful whenever market gaps higher.
A closer look at the chart above, it is clear that bullish candlestick forms immediately after the gap. The next candlestick opens lower and closes below the bullish candle. However, the bearish candlestick fails to fill the gap. What this means is that the uptrend is likely to continue, as the market is entirely bullish.
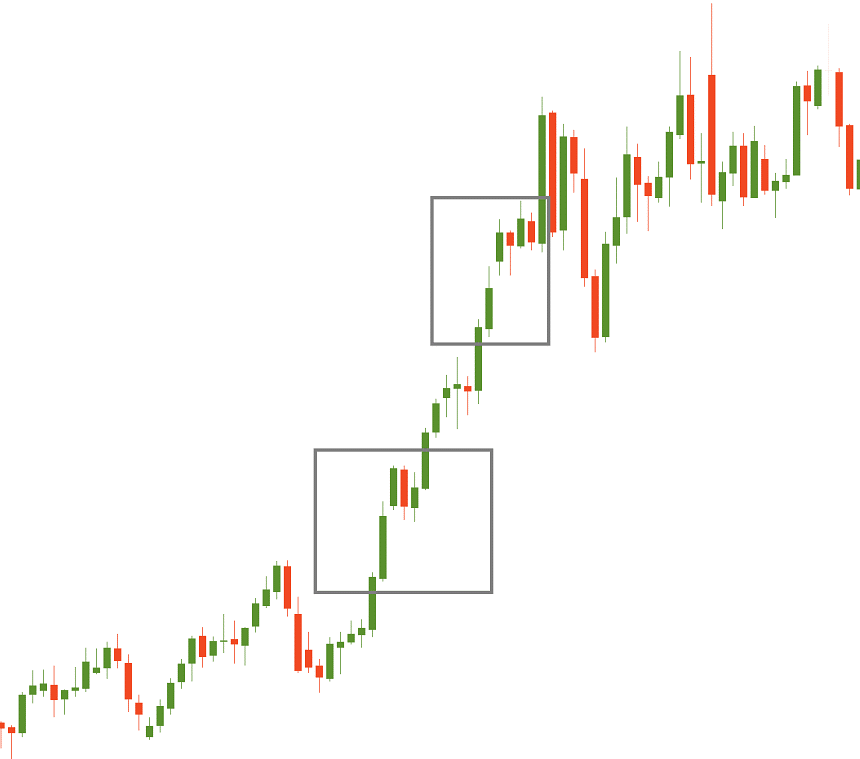
In this case, forex expert advisors, as well as automated forex trading systems, tend to open long positions on taking advantage of the slight pullback. From the chart above, it is clear that the price continues to move up on the bearish candle, failing to fill the gap.
Rising Three Method
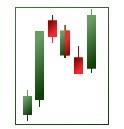
Rising Three Methods is another popular continuation candlestick pattern that technical traders, as well as FX Expert Advisors, use to trade markets in an uptrend. The candlestick patterns occur when a long bullish candle occurs in a trending market. Immediately after the bullish candle, small bearish candles appear as shown below.
However, given that the market is trending strongly upwards, it is clear that the bearish candles struggle to close below the long bullish candle. With the rising three methods, forex charting tools, as well as technical traders, watch for a maximum of three candles
It is important that the bearish candle does not exceed three and doesn’t close below the long bullish candle for the continuation pattern to work. Similarly, the final candle of the formation should open up in the body of the last bearish pullback.
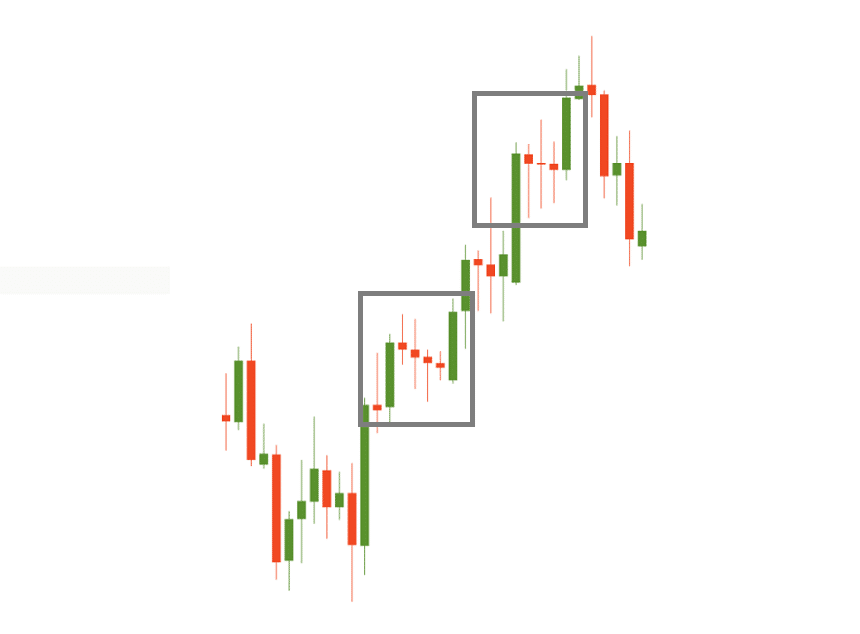
Once the candle stock closes, a trader or an automated trading system can use this opportunity to open a long position to bet on further upside action.
Three Line Strike
Three line strike is a bullish continuation pattern synonymous with a steep pullback
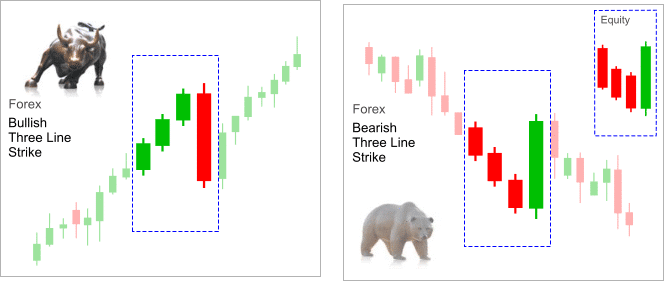
A closer look at the chart above, it is clear that the market was trending upwards, given the three strong green candlesticks that close higher, resulting in higher highs. However, on the fourth day, it is clear that price moved lower resulting in the creation of a long bearish red candlestick.
For the three-line strike strategy to work, the long bearish candlestick should fail to close below the first bullish candlestick. If this was to happen, then the likelihood of price resuming its uptrend and continuing to power high is usually high, as shown above.
Downtrend Continuation patterns
Descending Triangle Uptrend
A descending triangle pattern is a continuation candlestick pattern that occurs mid-trend when the price is trending downwards. After a massive sell-off price might consolidate, resulting in price oscillating in what appears to be a triangle.
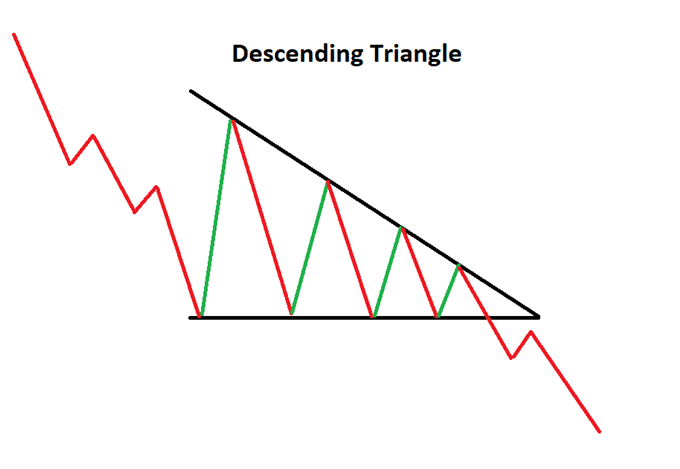
The continuation pattern is formed by drawing a descending upper trend line and a flat lower trend line. Similarly, it is common to find prices oscillating within the triangle forming higher lows.
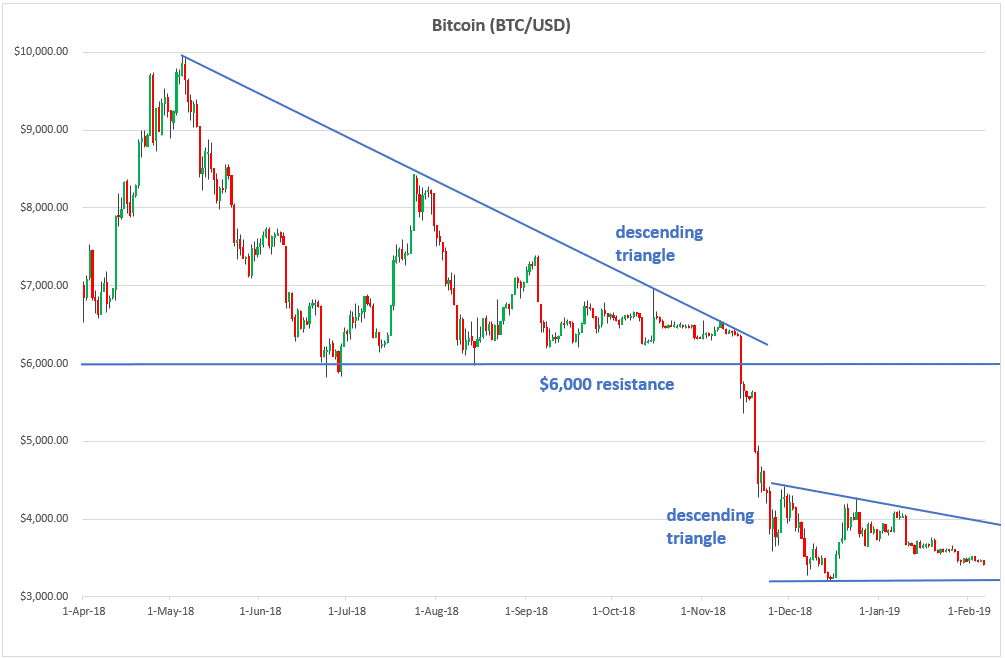
The Bitcoin chart above shows that once price broke out of the descending triangle, it continued to edge lower in continuation of the long term downtrend. Similarly, technical analysis and automated forex trading systems place sell positions below the triangle in anticipation that price will break out ad continue powering low.
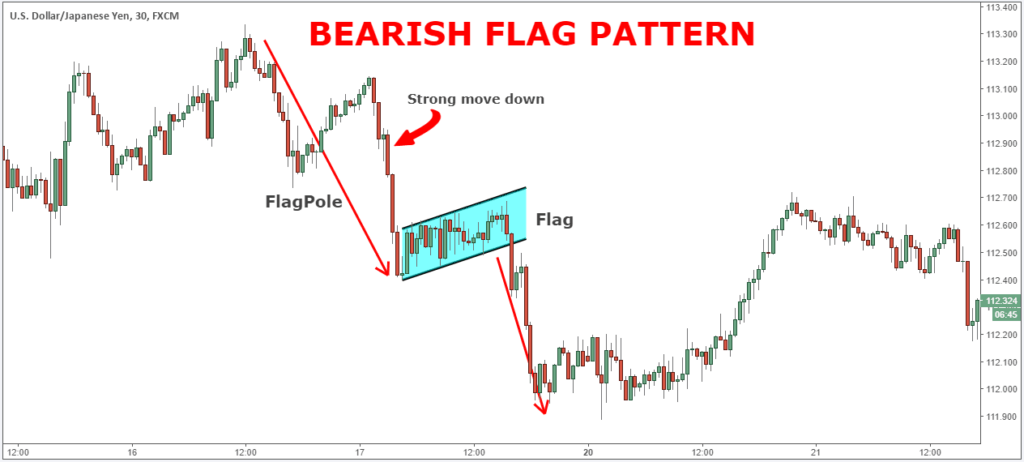
Bearish Flag
Bearish Flag is another popular bearish continuation pattern that traders and forex charting tools study when it comes to technical analysis. A bearish flag provides continuation to an existing downtrend. The continuation pattern comes into being following a long move downwards that results in price moving up significantly, resulting in the consolidation of price in a flag like structure.
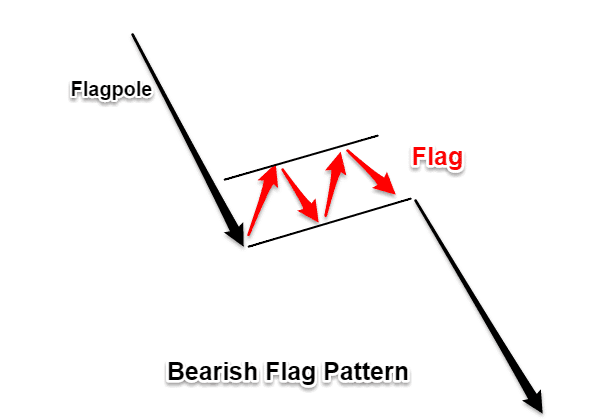
The sharp move down acts as the flagpole whole. The consolidation in itself is the flag.
The chart below shows that the USD/JPY currency pair had a strong move downwards, resulting in a pullback that culminated in the formation of a flag. Upon the price breaking through the flag it is clear that price continued to edge lower in continuation of the long term bear trend
Conclusion
Continuation patterns are widely used in technical analysis as they allow traders and forex robots to identify ideal entry and exit points when it comes to trend trading. While there are several continuation patterns, they are broadly classified into bearish continuation patterns and bullish continuation patterns.


