
Ability to identify ideal entry and exit points is an important forex trading skill. Likewise, any trader or forex robot should be able to hop into emerging trends as early as possible to squeeze in maximum profits. Conversely, reversal chart patterns are widely traded patterns as they allow traders to profit on an underlying trend reversing.
Reversal chart patterns are often leveraged in scalping as well as news trading and position trading. Likewise, there are two types of reversal candlestick patterns, which technical analysts and forex expert advisors look out for in technical analysis.
Bullish reversal chart patterns signal that an underlying downtrend has reversed, resulting in price moving in an uptrend. Bearish candlestick reversal pattern, on the other hand, indicates that an uptrend has reversed, resulting in a new downtrend.
Bearish Reversal Chart Patterns
Doji Candlestick Pattern
Technical traders, as well as automated trading systems, watch out for the Doji candlestick formation as it often indicates a potential reversal. The candlestick occurs whenever the opening and closing price are the same, resulting in a candlestick that does not have a body.
The Doji candlestick pattern is often associated with indecision or exhaustion in a given trend. For instance, if the price is trending upwards and the Doji candle appears as shown below, then it would be wise to anticipate a reversal.
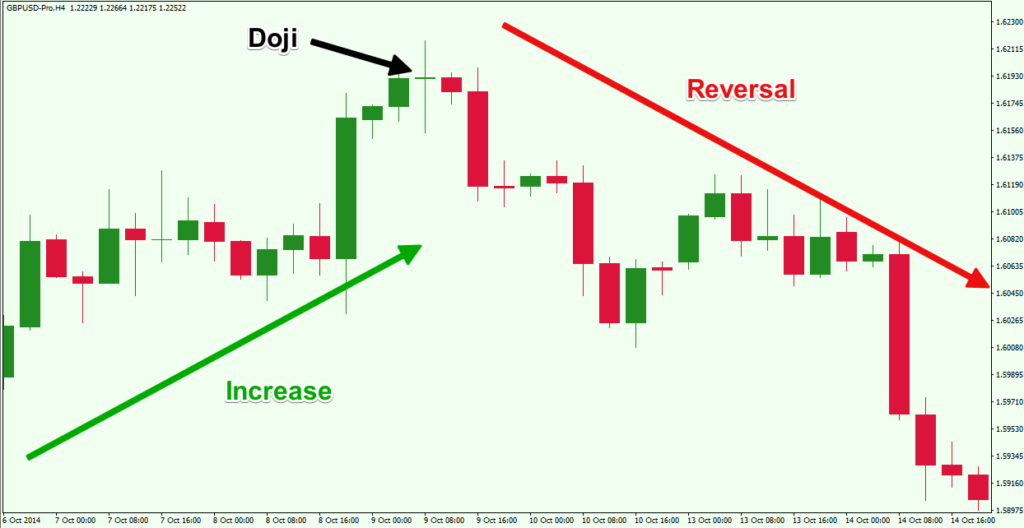
Similarly, traders, as well as FX expert advisors, would use this opportunity to enter a short position or a sell position. Affirming trend reversal, in this case, is the emergence of a signal candle in the form of a long bearish candle
Shooting star Reversal Pattern
A shooting star is another widely used candlestick reversal pattern that signals a potential bearish reversal. The pattern occurs as a one-candlestick pattern. The candlestick, in this case, appears with a small body with an upper shadow that is long and exceeds the body.
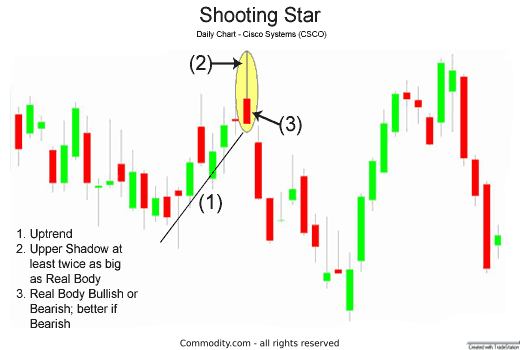
The long upper shadow with a small body indicates that bulls have come under immense pressure from sellers given the strong resistance. Therefore, it is common to see prices reversing from moving upwards and starting to move downwards, especially on the formation of a strong bearish candle afterwards, as shown above.
Bearish Engulfing pattern
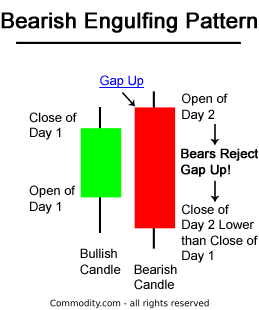
Bearish engulfing pattern is a candlestick reversal pattern that indicates bears are winning the battle for control against bulls. The pattern occurs at the top of an uptrend and consists of two candlesticks, as shown below.
In the chart above, it is clear that the green candle is bullish. The second candlestick, on the other hand, is bearish opening above the bullish candlestick and closing below it. If this chart pattern were to happen, then it would indicate a strong reversal signal as the bearish price engulfs the bullish pattern.
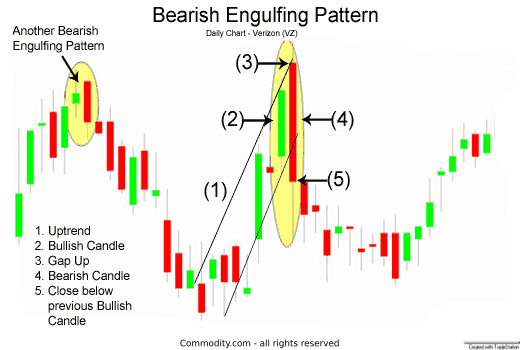
In the chart above, it is clear that a trader or an automated forex trading system would have opened a short position immediately after the engulfing bearish pattern happened. If there is a substantial increase in volume upon the formation of the engulfing pattern, then the same signals price has reversed from an uptrend to a downtrend.
Bullish reversal patterns
Bullish Engulfing reversal Pattern
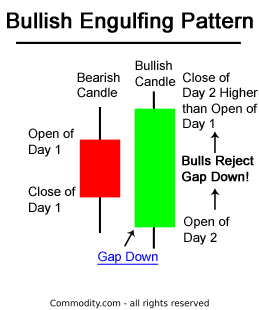
A bullish engulfing candlestick pattern occurs at the bottom of a downtrend. The candlestick chart patterns indicate that buyers are exceeding short-sellers, and that price has ultimately reversed. The chart pattern consists of two candlesticks.
The diagram above indicates that the bearish red candlestick is well contained within the green bull candle. The bullish green candlestick opens lower and consequently closes above the red candlestick. It is clear that the big green candlestick engulfs the small red candle.
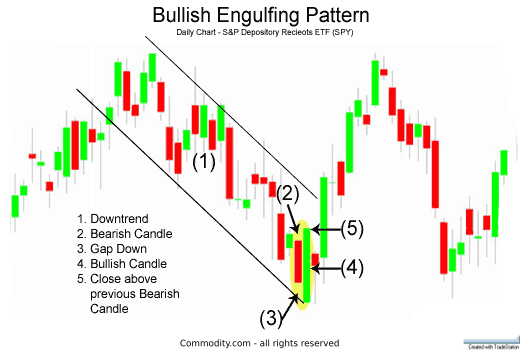
In the chart above, it is clear that once the bullish engulfing pattern occurred, the price moved up. Similarly, algorithmic FX trading systems, as well as forex trading instruments or manual traders, opened a long position on becoming clear that price has reversed from a downtrend to an uptrend.
Whenever the bullish engulfing candlestick pattern occurs, it signals an incredible change in sentiment from a bearish gap down to a large bullish gap up. Similarly, traders use this opportunity to open long position upon the emergence of a signal candle in the form of a long bullish candlestick
Double Bottom Chart Pattern
A double bottom chart pattern is a bullish reversal pattern that indicates a downtrend has lost momentum and that price is about to reverse upwards. A double bottom is synonymous with a downtrend. Similarly, price tends to find support at a given level whereby it struggles to go through in continuation of the downtrend.
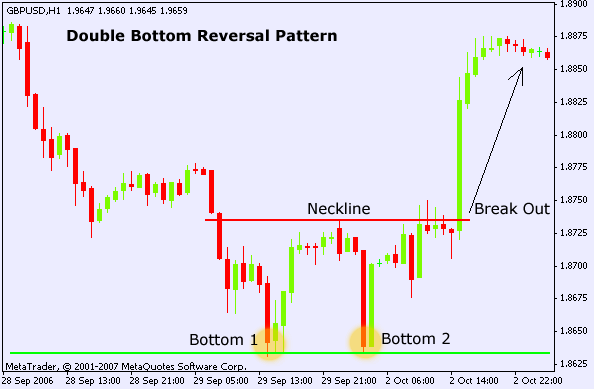
Whenever a double bottom happens, it is important to wait for the price to break above a peak, which in this case is the neckline as shown in the chart above. Once price closes above the neckline, the same indicates that price has reversed from a downtrend and that bulls are now in control. In this case, you can open a buy position with stop-loss order 5 pips below the neckline.
Conclusion
Reversal chart happens to indicate that the underlying trend has reversed and that the price is about to move in the opposite direction. There are two types of reversal candlestick chart patterns, bullish reversal chart patterns and bearish reversal chart patterns.


