
If you are looking for the best RSI strategy to spruce up your trading, you have come to the right place. Technical indicators are vital tools for any trader in the journey towards trading success. There are many traders out there but some are more common and useful than others. One of the most common ones is the Relative Strength Index or RSI. It is also one of the oldest technical indicators considering that it was conceptualized back in the 1970s by J.Welles Wilder.
The RSI is so popular perhaps because it is one of the most versatile technical indicators. There are multiple strategies where the RSI proves to be an important tool in a trader’s arsenal. Let’s take a look at some of the strategies that you should consider trying out.
What is RSI, and how it works
RSI is a momentum indicator widely used for determining the overbought and oversold conditions of the price. Initially, the indicator was used to assess the potential swinging area of the stock prices. Later, it has been discovered that RSI is equally effective for analyzing the market momentum of other types of financial assets like forex, commodities, indices, and cryptocurrencies.
The calculation process of the RSI is heavily dependent on the Relative Strength (RS) of the price. The RS value is determined by the average of the gain and loss of the price over the selected periods.
RS = Average gain of N-period / Average loss of N-period
Please note that the average can be calculated in 3 different methods such as high, low, and close. For example, the calculation method “close” means only the close prices of the candles will be counted to calculate the average gain and loss of the price within the selected RSI period. The standard period of calculating relative strength is 14.
Once you find the relative strength value, use the following formula for determining the RSI value of the asset:
RSI = 100 – 100/(1+RS)
Now, let’s have a look at how RSI helps us to determine the present strength/weakness of the price and the future projections.
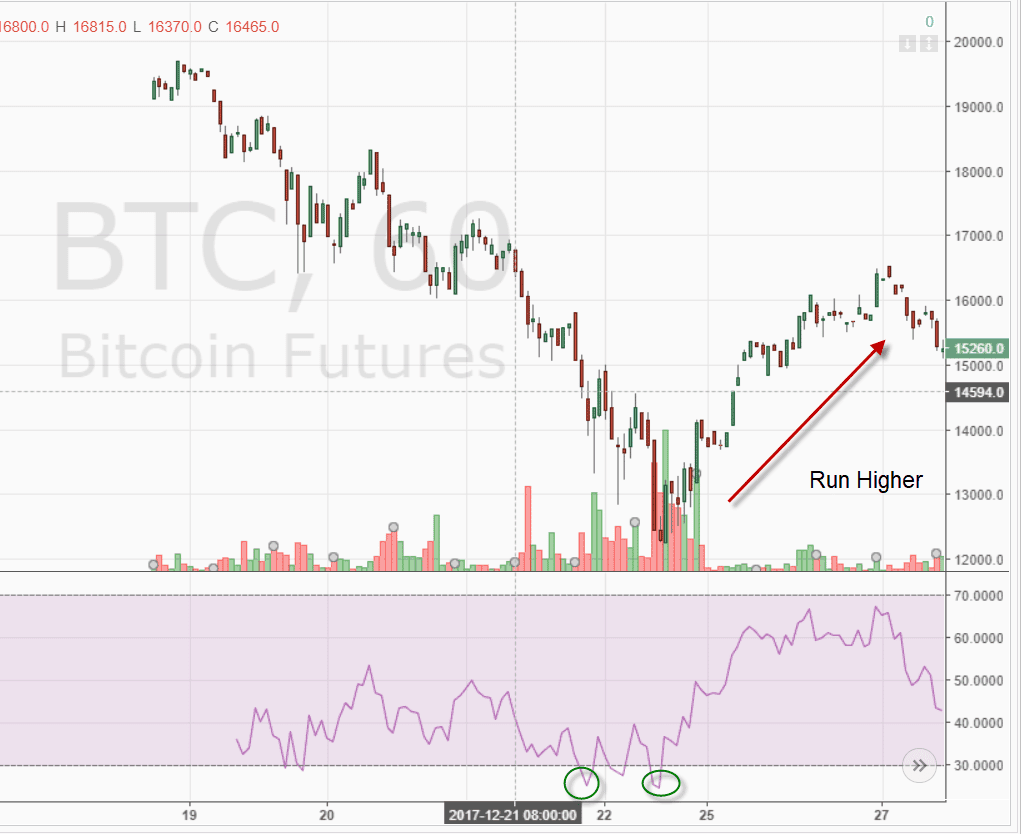
RSI is an oscillator indicator and uses a separate window for demonstrating the price momentum status. It plots three different levels at 70, 50, and 30. The 70 and 30 levels of the indicator represent the overbought and oversold areas of the price. The indicator value usually roams around its 50-level when the market is in a sidelined condition.
According to the above image, the indicator value starts to increase after being rejected from 30-level three times. It means the price is done with its oversold condition and now intends to start a fresh bullish move. Similarly, if the RSI drops below 70, consider the price is about to make a bearish move following its current overbought condition.
The RSI is so popular, perhaps, because it is one of the most versatile technical indicators. There are multiple strategies where the RSI proves to be an important tool in a trader’s arsenal. Here are some of the strategies that you should consider trying out.
8 Best RSI Strategies:
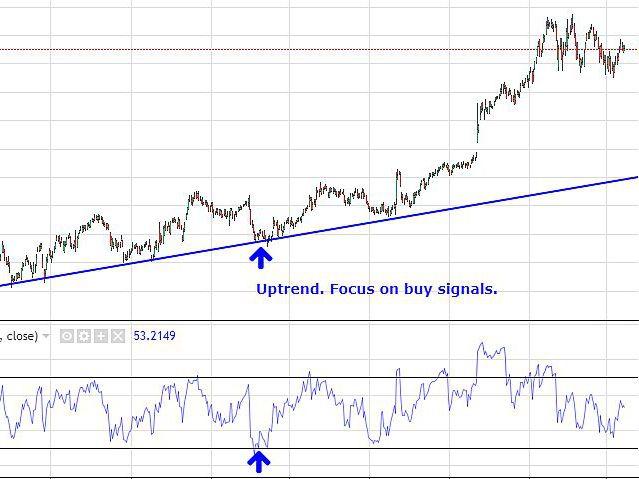
1. Determining trend direction
There are two key RSI levels that can be used to determine the direction of a trend. These levels are 33.33 for a bear trend and 66.66 for a bull trend. John Hayden introduced the concept in his book called RSI: The Complete Guide. Below is a demonstration of how traders can take advantage of those two levels to determine a potential trend direction.
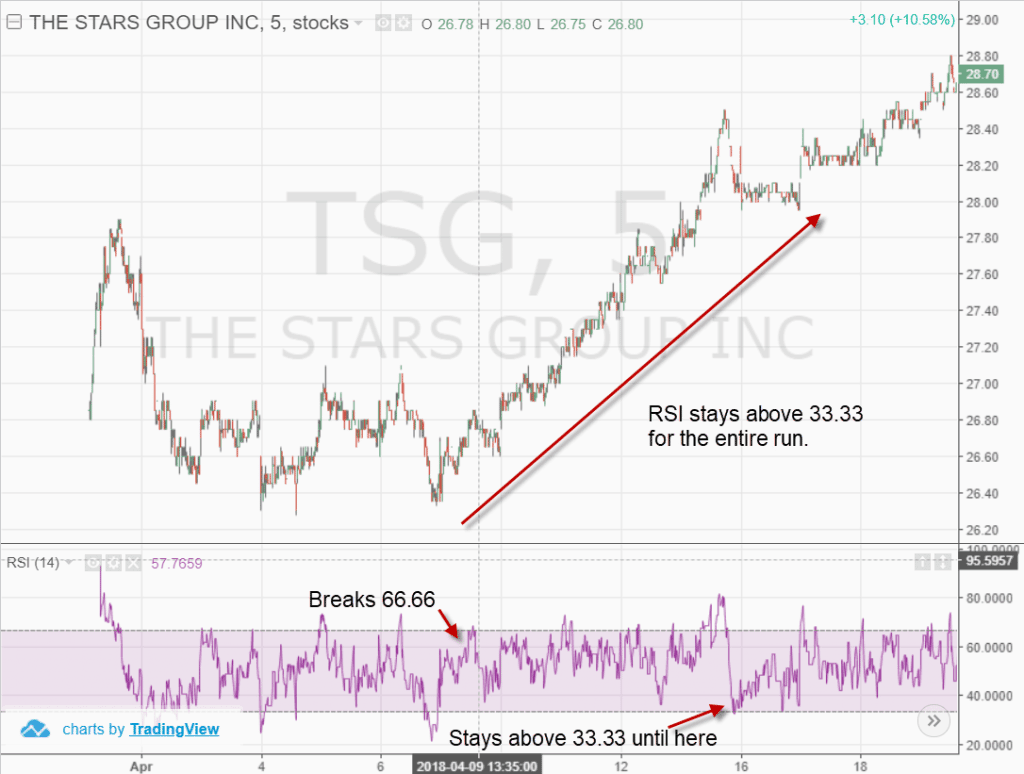
In the above example, the trend maintains a strong bull run after crossing the 66.66 level on the RSI. The trend remains relatively in the same direction and does not go down to the 33.33 level at any given time thus the trend continues on its bullish momentum.
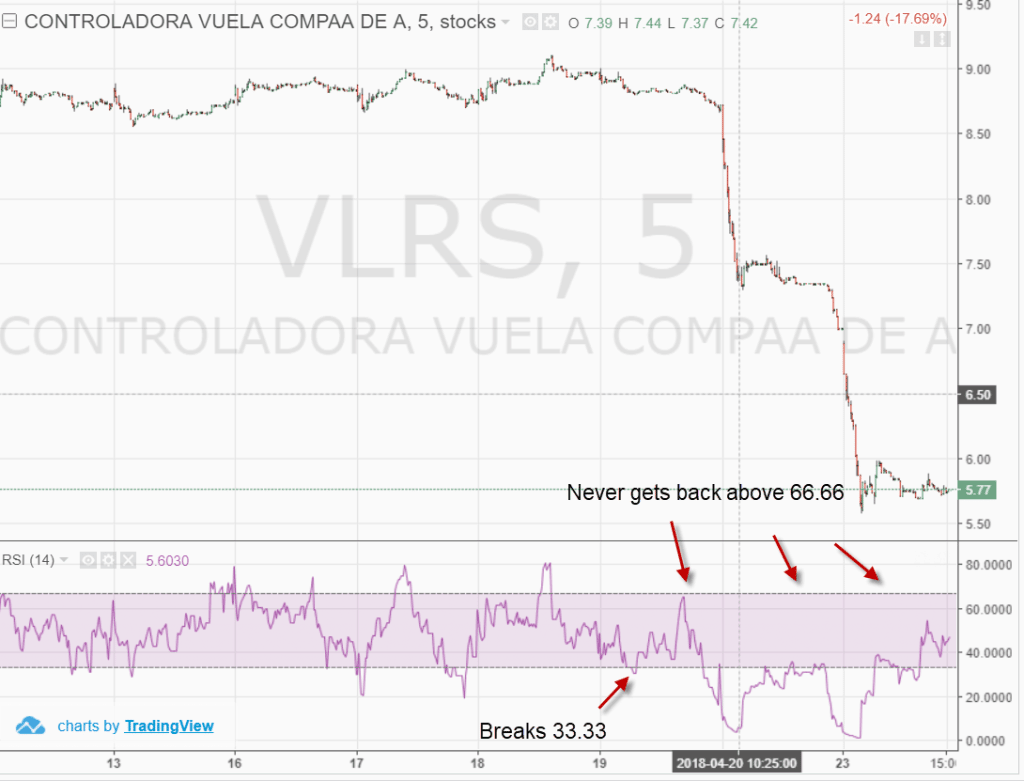
The second example demonstrates a strong bear run after the RSI crosses the 33.33 level. It maintains the momentum and does not at any point cross over to the 66.66 despite coming close.
2. Diverging RSI
The diverging RSI is one of the common RSI strategies that is used especially by forex traders to identify potential reversal points. In a bull trend, an ideal situation would manifest where the price manages to hit new highs but while the RSI fails to go past its previous highs. In other words, the price would achieve a higher high, while the RSI would play at a lower high as shown below.
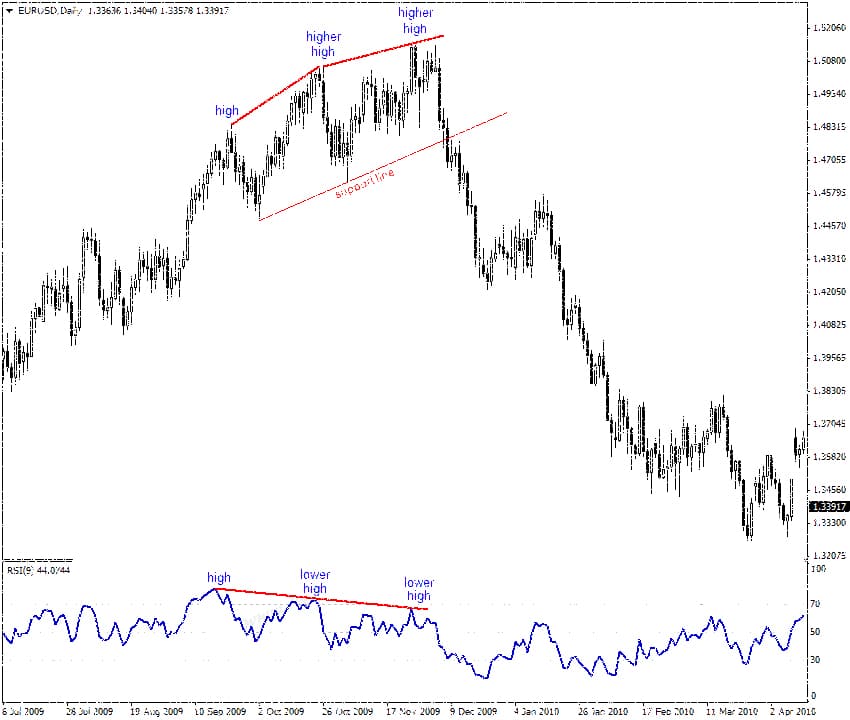
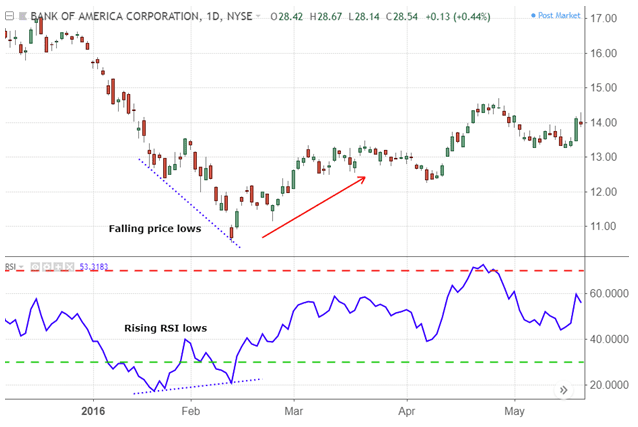
The same also applies in a bear trend. In such a situation, the price would reach lower lows but the RSI would achieve higher lows, thus failing to reach its previous lows as shown below.
3. The RSI 2 Strategy
The RSI 2 strategy is more commonly known as double bottom RSI and it is somewhat similar to the diverging RSI. It occurs when the price of a particular asset is rallying with the RSI considerably above 30.The setup occurs in case there is a selloff pushing the RSI below 30 before another rally occurs pushing it back, and then another selloff occurs pushing the RSI below 30. This is why it is called a double-bottom RSI strategy or RSI 2 strategy because it is pegged on the two pullbacks pushing the RSI below 30. This type of setup is more likely to indicate a price change in the opposite direction.
The dual-level RSI example above demonstrates the RSI going below the 30 level after a slight pullback, thus confirming the reversed trend direction.
4. The RSI Indicator strategy
The RSI indicator strategy aims to demonstrate the RSI’s power as a handy tool when it comes to identifying support and resistance-based reversal points. It turns out that trend lines can also be plotted on the RSI itself in the same way that they are usually plotted on the price charts. The advantage of this approach is that it helps traders to identify support and resistance lines where the price has a high likelihood of reversing.
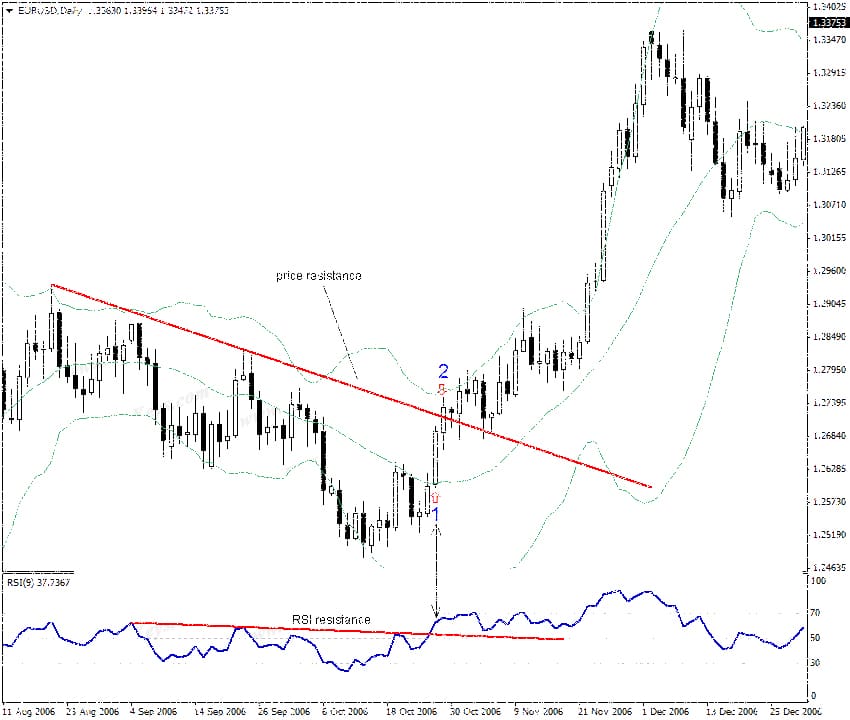
In the above example, both the RSI demonstrate breakouts on key support levels and then the price continues in the direction of the breakout.
5. The RSI overbought and oversold strategy
This is perhaps the most common RSI strategy out there. Traders who use this strategy basically assume that the price of an asset will follow a certain direction if it enters in the overbought or oversold zones. As far as application is concerned, it is a strategy that traders use to determine trend continuation. A trader would therefore place a trade on a bullish price when the RSI crosses past 30 on the RSI especially if it’s a clear bull trend. The opposite also applies where a trader would bet that the price would continue going down if the RSI hits 70 on the RSI in a bearish price trend.
The overbought and oversold strategy on the RSI is however, quite dangerous to use alone. It does not always accurately predict the possible price direction. It is thus advisable to combine this approach with other technical indicators that will help provide more confirmation on possible price direction. In fact, it is always a good idea to one or two other technical indicators to most of the above RSI strategies so that you have more desirable results.
6. The RSI 80-20 strategy
The RSI 80-20 strategy operates in a similar manner to the overbought and oversold strategy but instead, traders change the overbought from 70 t0 80 and the oversold from 30 to 20. This means that the RSI has a wider range before. You can also adjust the range from 14 to 8. The RSI 80-20 strategy is however more suited for reversals.
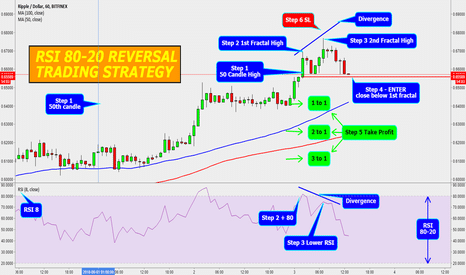
In the above example, the price is likely to reverse if the RSI goes above the 80 level on the RSI while on a bullish trend and on a bearish trend a reversal is likely to occur when the RSI hits the 20 level.
8. The Laguerre RSI strategy
This is an RSI trading strategy that also incorporates moving averages. The strategy is mainly suited for swing trading. The Laguerre RSI can be used for different timeframes such as 5 minutes, 15 minutes, 30 minutes and 4 hours. However, the 30 minute timeframe is recommended. You can set the period at 15, gamma at 0.5 and most importantly the RSI levels which can be set at 1, 0.75, 0.5, 0.25 and 0. This strategy is a little complicated. Traders have to watch out for the indicator to be at the 0 level for some time before crossing over the 0.25 level. It works more efficiently when the candle body that rises at least 5 pips past the 0.25 level. The fulfillment of these conditions on a bull trend is an indicator of a good entry point.
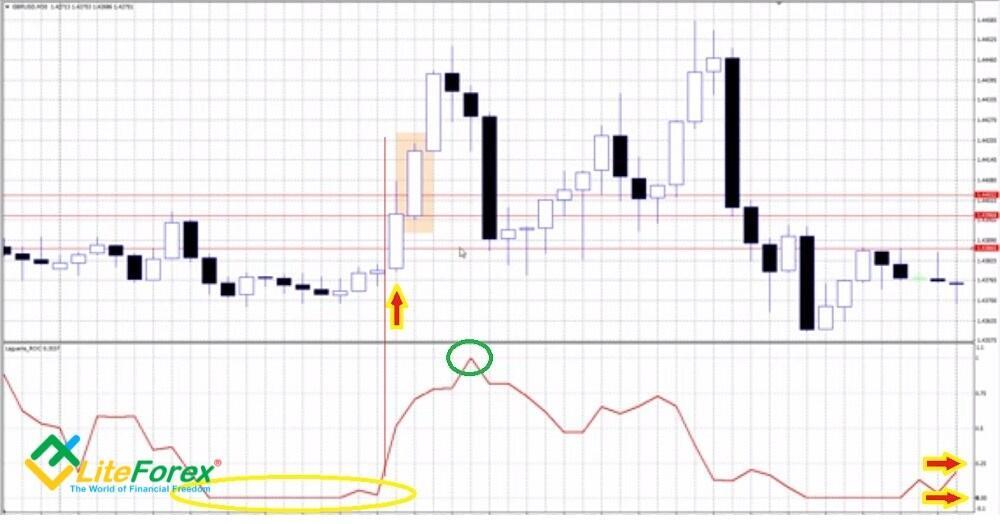
The same can be applied on a bearish trend when the RSI has been at the 1 level for a while and then it crosses over to the 0.75 level. The bearish candle crossing over to the 0.75 level has to travel downwards for at least 5 pips for it to be a viable short position.
Conclusion
Technically, RSI offers more than just a momentum indicator. Apart from analyzing overbought/oversold conditions, you can also use it for detecting trend directions and hidden divergences. Because of its great versatility, this indicator has been heavily used in varieties of trading strategies and systems. Besides, you can easily merge other trend and price level indicators with RSI for building your own trading strategy.
According to our in-depth research, RSI is one of the most reliable momentum indicators in the market. Besides expert professionals, beginners also admire this tool for its higher signal accuracy and great functionality as a technical indicator.
Last updated: July 29, 2021


