
A trend is a tendency for prices to move in a certain direction. The trends can be long-term, short-term, upward, downward, and sideways. A trader can spot this change and position themselves for quality entry and exit points to take advantage of the move. Some tools are used to identify and trade this scenario.
What is a market correction?
The relatively short-term market movement in the opposite direction of the primary trend is called a correction. In a bullish trend, a correction will be bearish, while in a bearish trend, a correction will be bullish.
Corrections occur when the market becomes overbought or oversold, as indicated by oscillator readings. There’s also what’s known as a horizontal correction, sometimes known as a sideways market or range. It occurs when the demand for a particular asset and its supply are equal.
They are always relative because they are linked to a timeline. The primary trend on the daily chart can be seen as a correction on the weekly chart. Everything is contingent on the scale. Various technical analysis setups may appear as the scale varies.
How do you identify and trade market corrections?
Using Fibonacci retracement
FX traders use Fibonacci retracements to help them discover crucial market correction levels. Combined with suitable risk management strategies, these levels are utilized as guides for traders looking to enter or exit the market.
A Fibonacci retracement is calculated by dividing the vertical distance between two extreme points on a chart (typically a peak and a trough) by the essential Fibonacci ratios of 23.6%, 38.2 %, 50 %, 61.8 %, and 100%. Before the continuance of the trend, retracements of 38.2 %, 50 %, and 61.8 % are common. If prices rise by more than 100%, it’s usually a sign of a possible reversal.
How to trade
Plot the Fib retracement levels in your charting application after identifying a market correction. Find where the price finds its support once it retraces, and it should be one of the Fib levels, but not at 100%. Use the support as the buy signal. Place the stop loss a level lower than the buy signal level. For example, if the support is 61.8%, you can place your stop loss at 78.6%.
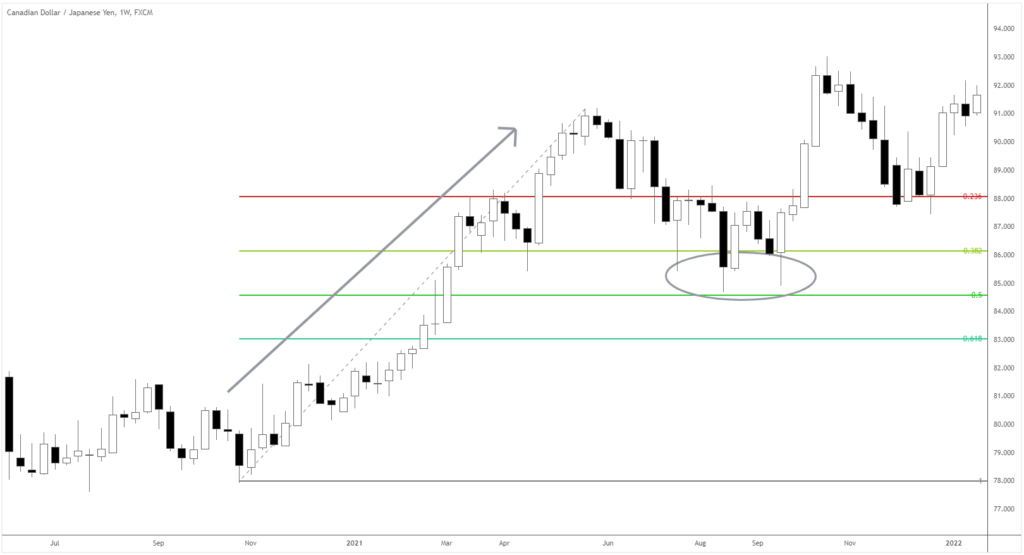
In the chart above, the price found support at 50% retracement level, which is a key support level. The circled area is located near the 50% correction of the trend marked with a grey arrow. As you see, the market rejected the area, presenting opportunities to go long. This verified the end of the bearish interim trend and the beginning of an uptrend. Place a stop loss at a level lower than 50%, a 61.8 retracement level.
Using RSI
Like any other oscillator, the RSI indicator is shown in a separate window below the price chart. The default settings are a single line and two levels. The indicator’s vertical axis range is set to 1 to 100, indicating how extreme the present price is compared to past values.
Overbought and oversold levels are usually 70 and 30, respectively. When the RSI goes above the 70 level, the market is considered overbought. It can last for a few pips before the market corrects itself and the trend reverses downwards. If the line falls below the 30, the market is considered oversold. The trend may reverse upwards.
How to trade
In the GBPUSD chart below, the RSI indicator showed that it was oversold, and there was a market correction.
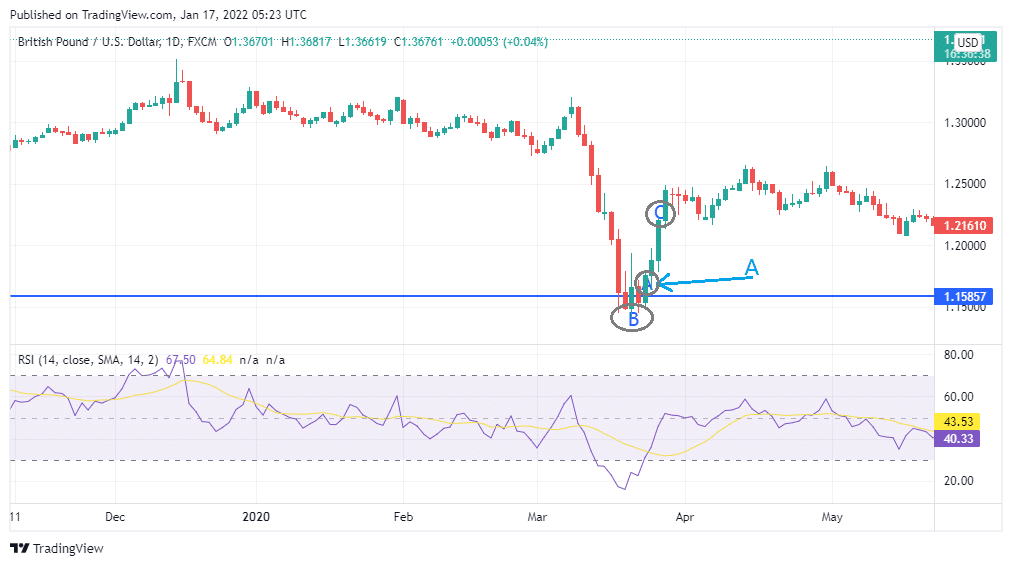
You could enter the trade at the point marked A, which is 1.15857. Place your stop loss at the point marked B, which is the lowest level before the market correction to the upside. The take profit should be placed at the point marked C, a potential resistance (the green candle and the round price 1.25 in that area give clues that the market may stall around there).
Other indicators
Pivot Point indicator
Investors use pivot points to map out quality support and resistance zones in the market. Investors have always been looking for areas where an underlying asset can find supply or demand. The Pivot Point generates several support and resistance lines, which can assist traders in determining the best entry and exit points.
Prices above the PP indicate a bullish bias, while prices below the PP indicate the bearish ones. The support and resistance lines define objective zones where traders will watch price action. This means that the lines can serve as trade entry and exit points for traders.
Stochastic Oscillator
A Stochastic Oscillator is a tool that compares an asset’s most recent closing price to its highest and lowest prices over time.
It provides readings between zero and 100 to indicate the momentum.
When the stochastic value exceeds 80, it indicates an overbought condition. The oversold state is indicated by readings below 20. The indicator compares the current price to the highest and lowest price levels during a specific period. The SO calculates data from 14 periods. For example, this would be 14 weeks on a weekly chart or 14 hours on an hourly chart. To utilize the tool, apply the same approach as RSI, but with 80 and 20.
Conclusion
A correction is a price rebound observed after a trend impulse. After a correction, the price returns to the original trend direction. One can use Fibonacci retracement, Relative Strength Index, Pivot point strategy, and Stochastic oscillator to find trading opportunities.


