Overview
The RSI (Relative Strength Index) is one of the most popular momentum oscillators in trading. A momentum oscillator attempts to document the velocity of an instrument. The RSI is a simple line graph with a reading from 0 to 100. We refer to readings below 30 as an oversold market, and we refer to readings above 70 as an overbought market.
All indicators reflect some average aspect of the price (low, high, open, or close) over a specific period of days. In the case of the RSI, it measures the momentum of the average of closing prices over 14 days (default period on the MT4 platform). In most cases, this period is adjustable, along with the 30 and 70 lines. The RSI indicator can be a highly commanding technical tool to identify critical components of price: divergence and momentum.
Divergence with the RSI
Divergence is a technical imbalance between the dynamics of price and what’s reflected in the oscillator. The RSI attempts to trace every directional change of price. A divergence happens when there is a mismatch between what the RSI traces and how the price moves.
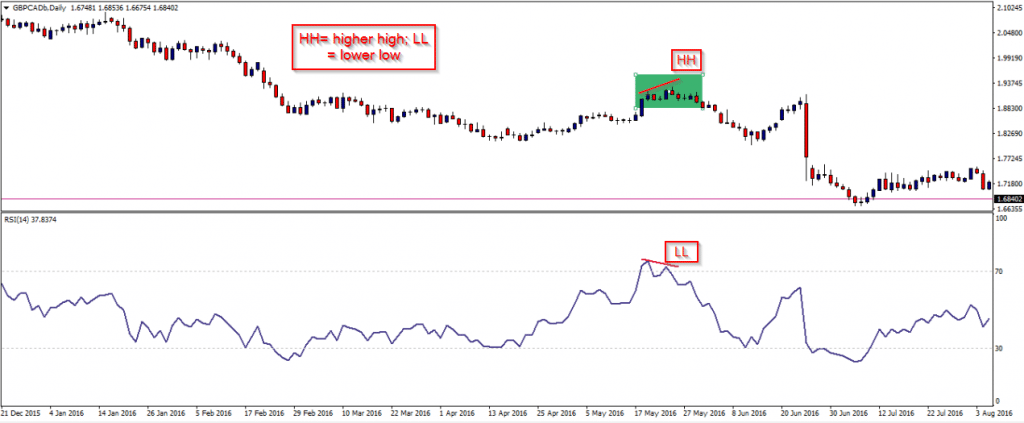
In simpler terms, at some point in time, if price reflects a higher high while the RSI reflects a lower low, we refer to this as a bearish divergence (vice versa for a bullish divergence). In a situation like this, the market would be making higher highs, suggesting that we are in a bull market. When the RSI suddenly reflects a lower low (a characteristic of a bear market), we consider this an imminent sign of a reversal looming.
Divergence is a staple of several momentum indicators such as stochastics and CCI. Generally, divergences on these oscillators work similarly, but the RSI is considered the better option. Depending on the time-frame, we can think of divergences both as a reversal or trend continuation signal.
Momentum with the RSI
In a strong-trending market, we can expect strong momentum as the market attempts to cover as much ground as it can quickly. What is interesting about momentum with the RSI is just as divergence reflects a mismatch between the chart and the indicator, RSI can show a similar kind of discrepancy. It does this by way of reflecting areas where the market changes from low to high momentum just as the divergence changes the market from trend to reversal.
We can think of momentum with the RSI in two ways: overbought/oversold and ‘fading’ momentum.
Overbought/oversold
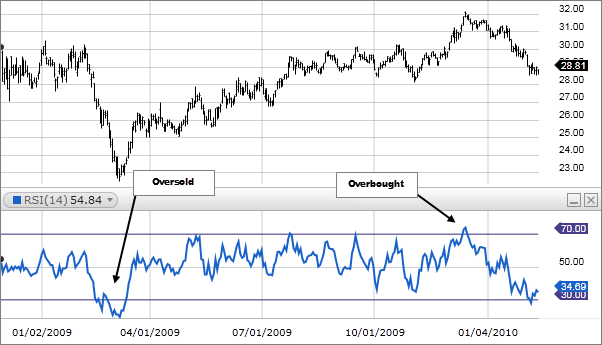
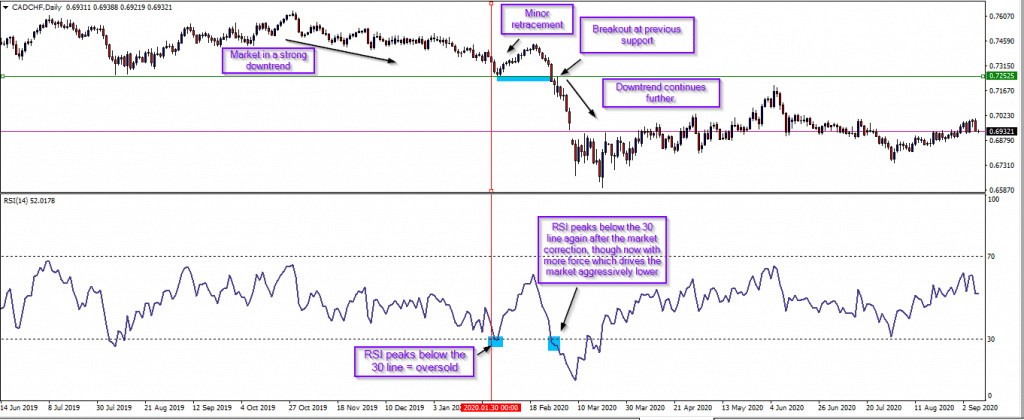
The concept of overbought/oversold is a popular but often misunderstood and misinterpreted characteristic of price with the markets. The idea of overbought/oversold is when the RSI hits the 30 line (oversold), for example, that should be considered a buy signal since the market is too low and naturally has to go the other way through retracement.
What often happens is the market typically retraces as it usually does after a strong push. However, trading these minor retracements is not sustainable for the mere reason of going against the current trend. However, some instances occur where the market unexpectedly reverses into a wholly new trend from these points (as in the image above). Albeit, this is a seldom occurrence. Hence, it’s safer that we assume touches at either beyond the 30 and 70 lines, respectively, are signals of trend strength and possible trend continuation.
‘Fading’ momentum
Conversely, there are many instances where price travels back into areas where there previously was an overbought or oversold area. We could imagine these areas as key supply and demand zones. The first consideration is sometimes the market can break out aggressively at previous areas of high momentum or overbought/sold market conditions. These events are sought after by breakout traders, though there is always a risk of a fakeout. This point also enforces the event where overbought and oversold market conditions can signal a continuing trend despite a minor retracement (as in the image below).
The second possibility is the opposite, where it could enter these areas with minimal momentum and ultimately begin a big trend to the other side. If the market reaches a previously overbought/oversold area with very little momentum, it may not have a choice but to generate new momentum to the other side. This simplified logic of momentum frequently occurs on the RSI.
Hence, we could think of the momentum as ‘fading’ purely as it suddenly changes, and this is a hugely under-valued component of the RSI. In the scenario of typical overbought/oversold markets, there is a risk of a fakeout. With ‘fading’ momentum, traders can capitalize on ‘taking the other side’ of the fakeout in anticipation for the reversal.
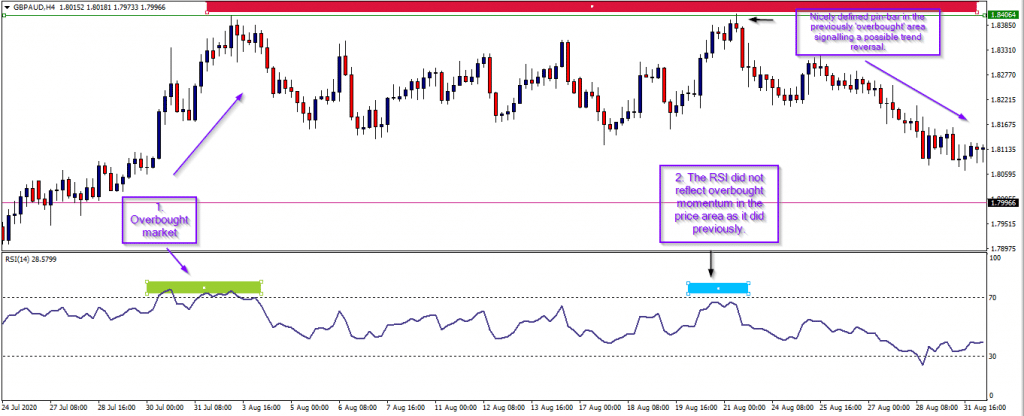
The image above highlights these concepts clearly. At the point marked 1, we can see an overbought market. Almost three weeks later, price returned to the same area where once it was overbought (point 2), though, at this juncture, there was little momentum. Furthermore, a perfectly-defined bearish pin bar appeared in this area exactly. We often consider pin bars as a powerful reversal sign. Soon after, the market did fall considerably.
All of these ideas tie into the principles of order flow in the markets. We believe that the so-called ‘big boys’ create these fakeouts and that they also ‘weed’ out the stop losses of traders that may have had stop losses in those areas. The price action would typically exemplify this action through patterns such as pin-bars (as in the image above) and other long-wick candles that suggest price initially seemed to break out, but aggressively changed direction.
Conclusion
The RSI is arguably the best momentum indicator, and its principles work very well across all traded financial markets. Studying the indicator can give traders unique perspectives on the dynamics of price momentum regarding trends, reversals, and key zones.


