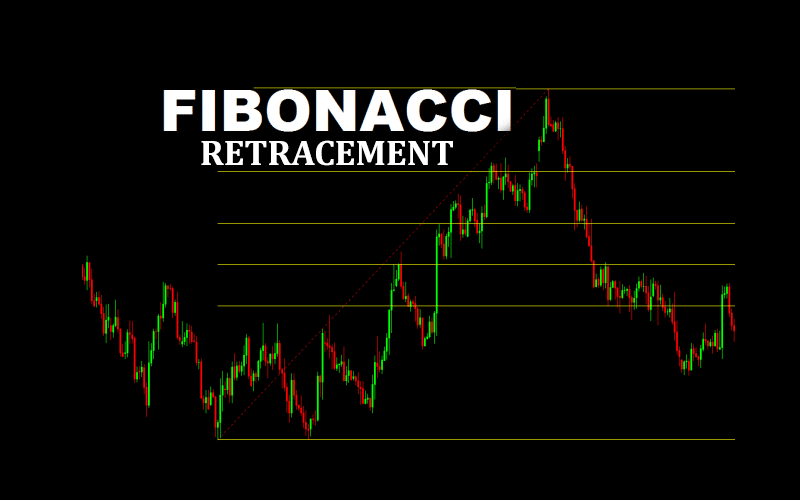
In the capital market, security prices don’t move in one direction. Once in awhile, price reversal does occur, resulting in price moving in the opposite direction. For instance, the price may start moving lower after moving higher over an extended period. The Fibonacci Retracement tool is often used by technical analysts to determine where corrections would experience strong resistance.
Fibonacci Retracements are simply ratios used to identify potential reversal levels. The ratios occur in sequence and are often denoted as 61.8%, 38.2%, 50%, and 23.6%. Chartists apply the technical indicator to define retracement levels and forecast the extent of a correction or a pullback.
The retracement levels are static levels that don’t change, as is the case with other technical levels. The static nature allows quick and easy identification, allowing traders and investors to anticipate and react prudently.
How Fibonacci Retracements Work
The indicator is often drawn between two significant price points, a high and a low. The indicator will then draw the retracement level between the two levels indicating potential support or resistance levels.
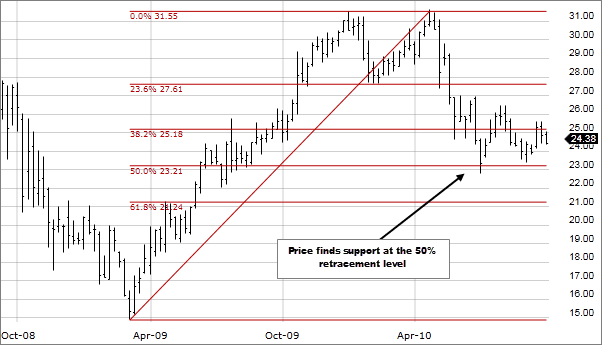
Consider the chart above whereby price rises from $15 on April 9 to $ April 31 10 next year. After reaching the new high, the price reverses and starts moving lower. Inserting a Fibonacci retracement indicator in the chart makes it much easier to identify possible support levels on the pullback.
In this case, the Fibonacci retracement tool is drawn starting from the $15 price level to $31. The chart above shows that price experiences strong support at the 50% Fibonacci retracement level.
Fibonacci Retracement Levels Uses
The Fibonacci retracement levels 23.6%, 38.2% 61.8% are often used to place entry orders as they act as ideal support and resistance levels in trending markets. Likewise, technical analysts use them to determine to stop loss levels and set price targets.
For instance, consider the S&P 500 moving higher and suddenly reverses and starts moving lower. After retracing significantly, 38.2% emerges as a support level form where the retracement stops and price starts moving higher.
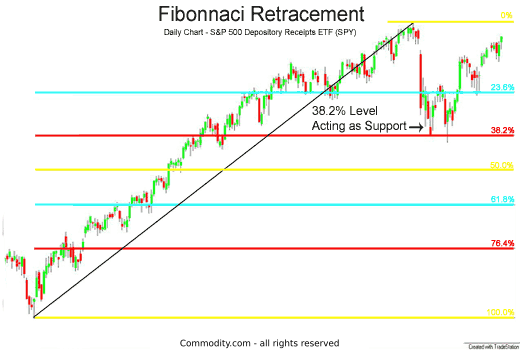
Since the reversal occurred at the 38.2% Fibonacci retracement level, a trader could have entered a buy order with a stop-loss order placed slightly below the 61.8% level.
Types of Fibonacci Retracement
There are three main types of retracements that the Fibonacci tool captures when it comes to price action. The 23.6%, 38.2%, 50%, and 61.8% signal the retracement’s depth that occurs in the market.
Shallow Retracement
The 23.6% Fibonacci retracement is often referred to as a shallow retracement and occurs in steep markets where small pullbacks often play on traders taking profits. Such retracements are synonymous with flags patterns or short pullbacks.
Whenever they occur, they often result in price reversing and continuing to move in the direction of the underlying trend with force. While Shallow Retracements do occur most of the time, they require closer watch and quicker trigger fingers.
Moderate Retracements
Moderate Fibonacci retracement occurs whenever price reverses and finds support at the 38.2% level. The retracement is often seen as a corrective move. In the chart below, it’s cleared that as price reversed lower, it found support at the 38.2% Fibonacci retracement level.
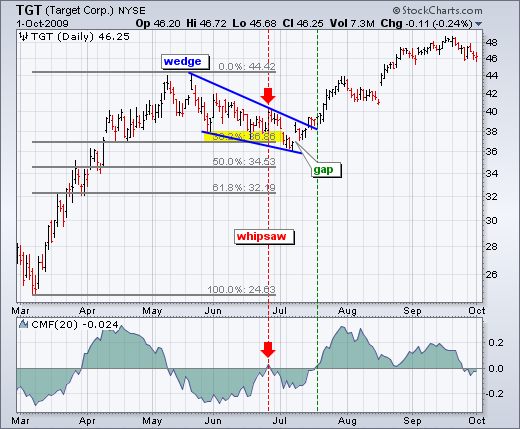
In this case, bulls came back into the market, resulting in price gapping higher before breaking out of the wedge to continue the long-term uptrend.
Golden Retracement
Golden Retracement provides an opportunity to profit from a deep pull back from a higher or lower low. The retracement occurs whenever prices pull back and find support at the 68.2% Fibonacci level.
While a deep pullback to the 68.2% level would often arouse concerns of a potential long-term trend reversal, such pullbacks provide ideal trading opportunities given the amount of room in price bouncing back to the previous high or low.
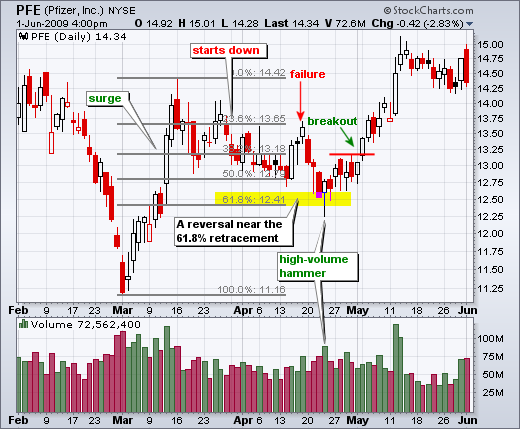
In the chart PFE chart below, the stock price started edging lower from the $14.50 level. While it initially found support at the 50% Fibonacci retracement level at $12.75, price did plunge before once again finding support at the $12.50 level, which happens to be the 68.2% retracement level.
Once price bounced off the support level, it rallied, breaking out to register new all-time highs of $15.
Fibonacci Retracement or Drawing Price Levels
Fibonacci retracement levels do not have formulas. Instead, they are determined outright by the indicator, upon connecting two extreme levels, one a high and another low depending on the trend. The Fibonacci tool has proved to be highly effective in determining critical points where price often reverses after a correction.
Likewise, it is possible to draw lines on the chart, which would act as ideal support or resistance levels for determining potential reversal levels. The reversal lines are often drawn, considering how price behaved at given levels in the past.
Fibonacci Retracement levels Drawbacks
While Fibonacci retracements indicate potential support and resistance levels in reversals, there is usually no assurance that price will stop at a given level. The price might breach a given retracement level and continue moving in the opposite direction than expected. Likewise, it is essential to use other confirmation signals or indicators to affirm ideal support and resistance level.
The fact that there are so many Fibonacci retracement levels makes it extremely difficult to determine in advance at what level price is likely to reverse. Similarly, it is difficult to determine which level is useful at any particular time.
Bottom Line
A Fibonacci retracement tool is a powerful tool for identifying potential reversal points for technical analysis. The tool is used to determine the end of a correction or a counter-trend bounce. While 23.6% retracement does occur most of the time, 38.2% – 61.8% retracement levels act as ideal reversal alert zones. A correction phase often comes to an end, resulting in price reversing and continuing to move in the direction of the underlying long-term trend.


