
Moving Averages (MAs) are among the most commonly used indicators in the forex market. There are several types of this tool, all running on the same primary premise – averaging prices over a specified period. These include the Hull MA, Simple, Exponential, Arnaud Legoux MA, and of course, the Weighted MA. Of these, the simple, exponential, and weighted MAs are the most common.
WMA description
To best describe this tool, let’s break it down into its constituent components. An average in mathematics describes the mean of a set of figures, which is obtained by summing the members of the set and dividing the result by the set’s population. A Moving Average means that the mean is not fixed, but rather it keeps shifting as new members of the set are introduced. This average being weighted means that all numbers in the set do not carry equal value – some take preference over others.
To calculate the SMA, one would need only average the prices over the given period as they would any other average. All prices carry equal weight here. For the WMA and EMA, the most recent values are given more weight, but these two differ slightly in how they are calculated. By multiplying each price by a weighting factor, the EMA and WMA manage to follow prices much more closely as compared to the SMA.
How is the WMA calculated?
This tool involves giving more weight to recent prices than their earlier counterparts. This is done by multiplying each price by a gradually reducing weighting factor, beginning from the most recent one. Let’s look at an example.
Assume we are calculating a 7-period WMA. We shall assign P1 to the most recent price, P2 to the second most recent, until P7 as the earliest price considered in this calculation. The calculation thus becomes:
WMA = (P1 * 7) + (P2 * 6) + (P3*5) + (P4 *4) + (P5 * 3) + (P6 * 2) + (P7 * 1) / (7+6+5+4+3+2+1)
By default, most charting platforms will calculate this MA using closing prices. However, you can always change settings to compute it using opening prices, highs, or lows if you so wish.
Use cases of the WMA
1. Trend confirmation
Like other MAs, the WMA often provides support during rallying markets and resistance during declining markets. Following this characteristic, one can use this tool to trade long market trends. The first step in this approach would be to look for a trend, whether bullish or bearish and then apply a WMA of an appropriate period length depending on the strategy.
If the market is in an uptrend, a long trade can be opened and kept open for as long as prices remain above the WMA line. On the other hand, if the pair in question is declining, one can open a short trade and keep it running for as long as prices remain below the WMA line. The chart below demonstrates this method in practice.
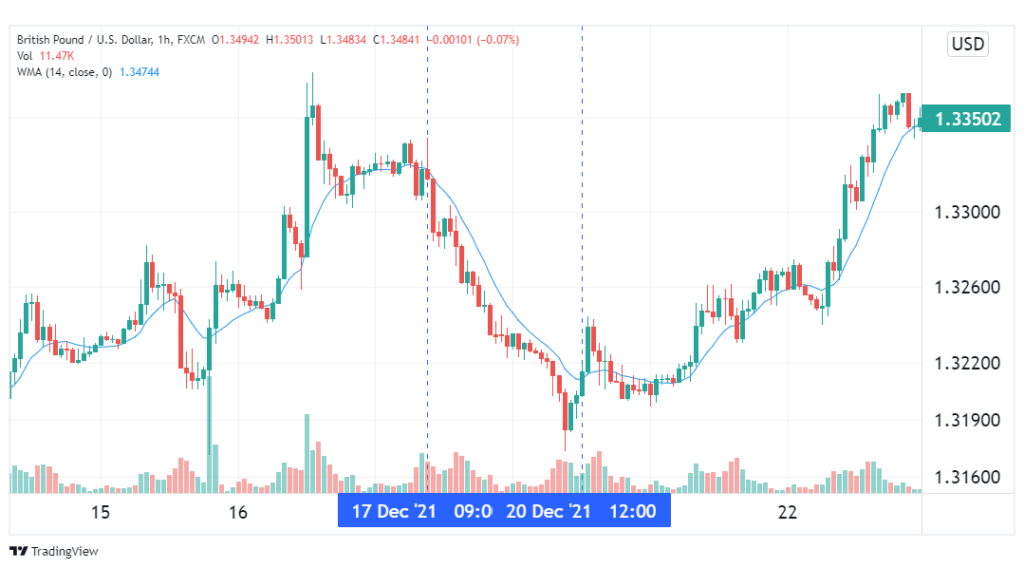
From the illustration above, we can see the GBPUSD declining between the 17th and 20th of December, 2021. As expected, prices broke below the 14-period WMA as the downtrend started, which marked an ideal entry for a short. Observably, prices continued to use the WMA as resistance for as long as the trend persisted. Eventually, on the 20th, prices broke above the resistance, marking the end of the trend and suggesting to exit our short trade.
2. Identification of reversals
Another popular use case of the WMA is identifying reversals of major trends, which serve as entries for the relevant trades. This is done by using two MA lines of different period lengths, one shorter than the other. The next step would be to wait for crossovers of these two lines, which signify an incoming change in trend.
Short-term traders often have to vary these lengths to find those that work best with their strategy. Long-term traders, however, have it easy since there is a phenomenon known as the death cross and golden cross that occurs using a 50-day and 200-day combination.
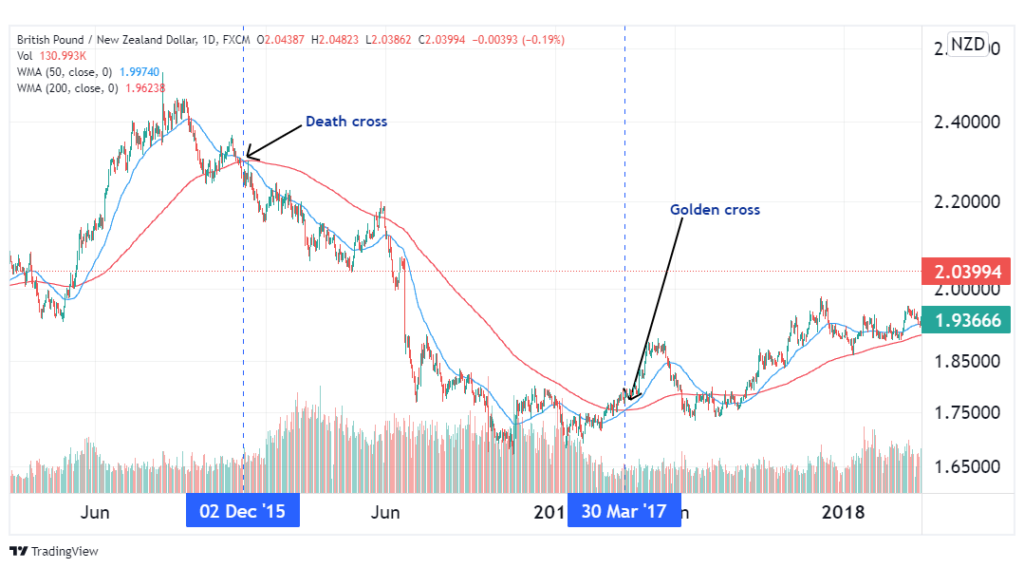
In the example above, we see the death cross manifest when the shorter-term WMA crosses below the longer-term one. This marked the beginning of a bearish trend for the GBPNZD pair, which would have been the signal for long-term traders to go short on the pair. Two years later, in 2017, the two Moving Averages displayed a golden cross, marking the end of the prolonged decline. This was the signal for the bears to take their profit and exit their positions.
Battle of the MAs – Which of them is truly superior?
We established that the simple, exponential and weighted MAs are the three most commonly used tools of their type. But which of the three posts the best results?
Moving Averages are lagging instruments, mainly because they are based on past data. Therefore, the signals they yield will often come after the price action has begun, rather than predicting it before it happens. Therefore, it follows that the superior MA is that which has the least lag among its peers. To that end, due to the weighting factor, the WMA has the least lag, followed by the EMA, and the SMA features the most lag from price action.
Conclusion
The WMA is an indicator that averages prices over a given period by assigning more weight to the most recent price data. This enables it to follow the market much more closely, reducing the lag component that is characteristic of Moving Averages. This tool can be used to identify trends as well as their reversals, which makes it an important addition to any FX trader’s arsenal.


