
Simple and Exponential Moving Averages are similar in many respects. They are understood by traders in the same fashion and utilized to smoothen out the price fluctuations. But, there are marked differences between them as well.
In today’s article, we go through each of them separately and look more closely at their specific characteristics. Let’s dive in.
What is Exponential Moving Average (EMA)?
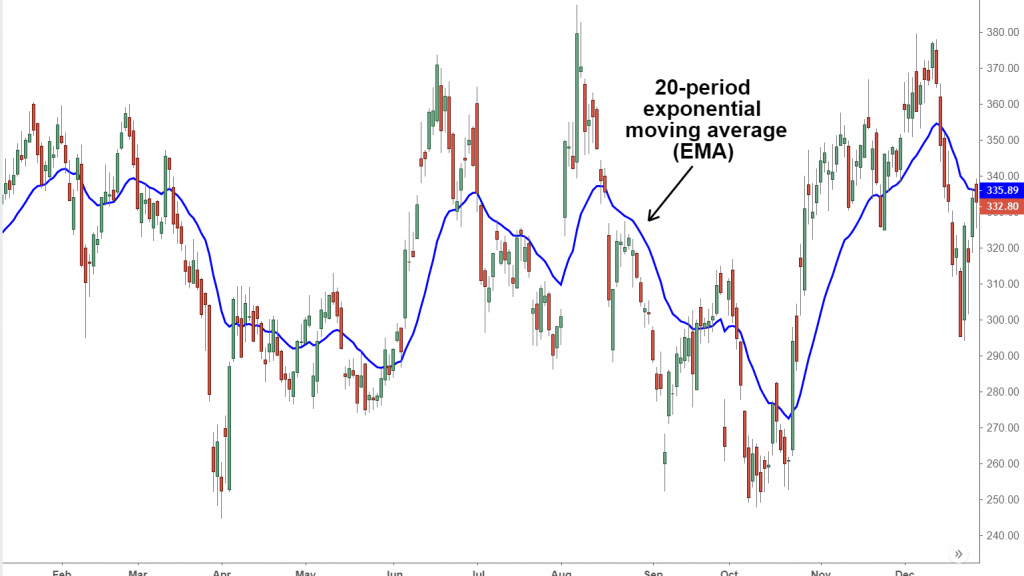
EMAs place special emphasis on recent data rather than historical data, and this is why they tend to be more reactive to price changes than their counterparts. Thus, one gets timely results from EMAs. There is little wonder then why they have traders’ preference.
Traders dealing only in the short term may not give much thought to which average is being used since the differences to them is akin to splitting hairs. However, those who are dealing in the long-term, that is the duration between their buying and selling consists of a few years, would place special emphasis on which average they use as the values can change by a few units. That is usually enough of a difference to have an impact on the returns, which is of major concern when one is trading in large quantities.
Then again, as is the case with technical indicators, no one type of average will guarantee success to a trader. EMA is determined by finding the difference between the recent period’s price and the previous EMA. The more weight is given to the recent price, the shorter the period gets.
The formula for calculating EMA is:
EMA = Price (t) × k + EMA (y) × (1−k)
Here, ‘t’ refers to today, ‘y’ refers to yesterday, and k is 2 ÷ (N+1), n is the selected time period.
What is the Simple Moving Average (SMA)?
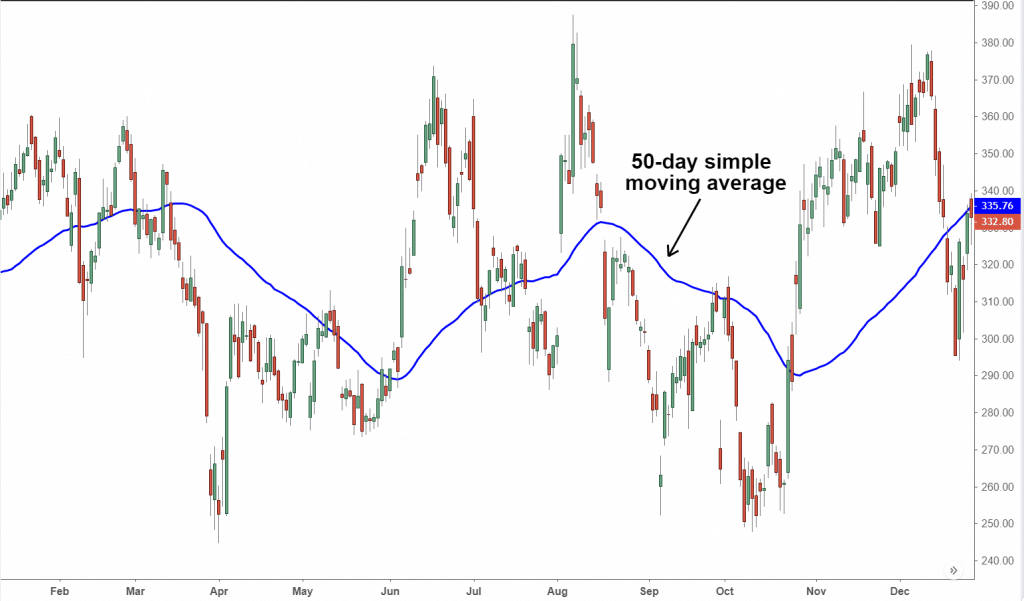
This is the most common average type that technical analysts use. It is easy to figure out as well since it is just the sum of a set of prices divided by the total number of prices in the series. For instance, a five-period MA is determined by adding the five prices and dividing it by five.
The formula for calculating SMA is:
SMA = ( Sum ( Price, n ) ) / n
Here, the sum is the total price of an asset and ‘n’ is the number of time periods.
Main Differences
The chief divergence for the two types of averages is how they are calculated. This allows traders to react to the EMA quicker in the face of changing prices while the SMA is slower in that respect. This is the only key point of divergence for them.
Many times in reaction to the EMA, a trader will get out of a trade quickly when facing a market contravention, but the trader who is following the slower pace of the SMA stays in position and receives a fat profit once the market fluctuation has decreased.
The opposite could equally well happen too. The EMA indicates that there is impending trouble faster than the EMA, which allows the trader to get out faster, saving him/her precious money and time. One is not necessarily better than the other. One simply has to decide which one would be more suitable, depending on the strategy being used.
As a rule of thumb, whenever the price is above either of the averages, the trend is upwards; when it is below the averages, it is a downtrend. However, for this rule to have any real use, one has to have insights into the previous trend changes and the current trend as well. This applies to both averages. Either of them will work differently on a variety of financial instruments.
Another thing to keep in mind is that these moving averages work well as support and resistance bands. When there is an uptrend, prices will often return to the MA and bounce back off like a spring.
In an uptrend, if the prices move below the MA, the trend may either be:
- Losing steam.
- Beginning to consolidate.
Conversely, if in a downtrend, the price moves above the MA, the trend is reversing or consolidating. In such cases, traders have to be watchful of the prices moving through the MA that may indicate danger or opportunity.
Which One is Better?
One is bound to wonder which one of the two is better, given the fact that most traders do use the EMA. The simple answer is this: for the short-term, the EMA is appropriate; for the long-term, the SMA. The strength of the EMA becomes a bane when the time period is elongated, and the reverse is true for the SMA.
Because the EMA tracks and moves with the price faster than its counterpart, it frequently triggers panic that is not exactly ideal for gaining opportunities to enter or exit on longer time frames, such as daily, weekly, monthly, or yearly.
The slow lag of the SMA smoothens the price over time, which is what is required from an indicator in the long-term, thereby allowing the trader to stay long as the price moves above the SMA and short when it is below it.
Ultimately, a trader shouldn’t limit himself/herself to either one. A lot of the traders plot multiple MAs to give them a holistic view of the story. A broad-minded trader would use the SMA to find out the trend as a whole and then go back to utilizing the EMA to know the best time to enter/exit a trade.
Some traders don’t concern themselves with prices moving through the MA. Instead, they put the two MAs together and see where they cross. Such a crossover may bring out signals that may reap amazing profits, but they also bring about poor signals. As such, we have one weakness of the MAs. When the price is trending in big moves, the MAs work well. But, when it is moving sideways, it performs poorly.
That being said, a trader should definitely try out both the MAs involving multiple strategies to find out which one (or which combination) works best for them.


