
Moving Averages are arguably one of the most common indicators known to FX traders. However, they suffer from one major shortcoming, lag. Where others saw adversity, famous analyst Alan Hull saw an opportunity to create a better MA, on which the issue of lag was significantly reduced, without sacrificing on the smoothness of the indicator. Following his efforts, it comes as no surprise that the indicator was named after him.
Defining the HMA
Moving Averages work by averaging closing prices of a particular currency pair over a specified period. Simply put, they are obtained by summing all the closing prices over a period, then dividing the result by the number of periods. This yields a Simple Moving Average, which is the most primitive of its kind. Since it assigns equal value to all periods, it usually features the most lag behind prices.
To solve this, the Exponential Moving Average was developed. This EMA assigns more weight to the most recent data. This improved the lag ever so slightly, which called for more adjustments. Enter Alan Hull, who developed his HMA in 2005. The goal he had in mind was to reduce this lag almost to zero, all while maintaining the resulting curve’s smoothness.
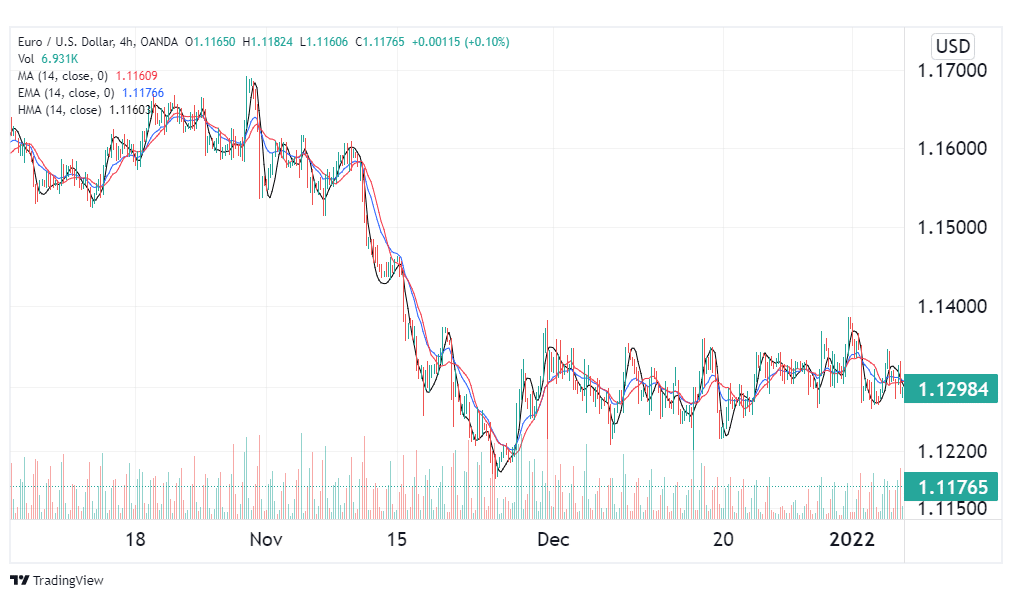
The illustration above shows the three aforementioned MA types on a EURUSD chart. Notice how the HMA in black hugs prices more closely than the red SMA and the blue EMA. This shows that it is more responsive to price movements and hence features the least lag of the three.
How to calculate HMA
We have established that the HMA was built upon the EMA, which utilizes weighted averages. Therefore, it follows that to calculate the HMA, we must first obtain the Weighted Moving Average of our pair over the specified period. Here, we will calculate two WMAs, one of the period specified, and another of half the number of periods.
WMA1 = WMA (n/2)
WMA2 = WMA (n)
The next step will be calculating the raw HMA. This is an HMA line that has not yet undergone smoothing. It is obtained by computing:
Raw HMA = (WMA1 * 2) – (WMA2)
The final step entails smoothing the raw HMA using the WMA as follows:
HMA = WMA (square root (n) of raw HMA)
If this process seems too complicated, worry not – most charting platforms will offer the indicator for free, so you won’t need to calculate it.
Use cases of the HMA
1. Trend following
The tool can be used to identify long price trends as they happen. If a market is in an uptrend, the HMA will typically trend just below prices. Such a scenario would call for the entry of long trades. A bearish market, on the other hand, would have the HMA trending above the declining prices. If such a situation were to manifest, traders would be looking to enter short trades.
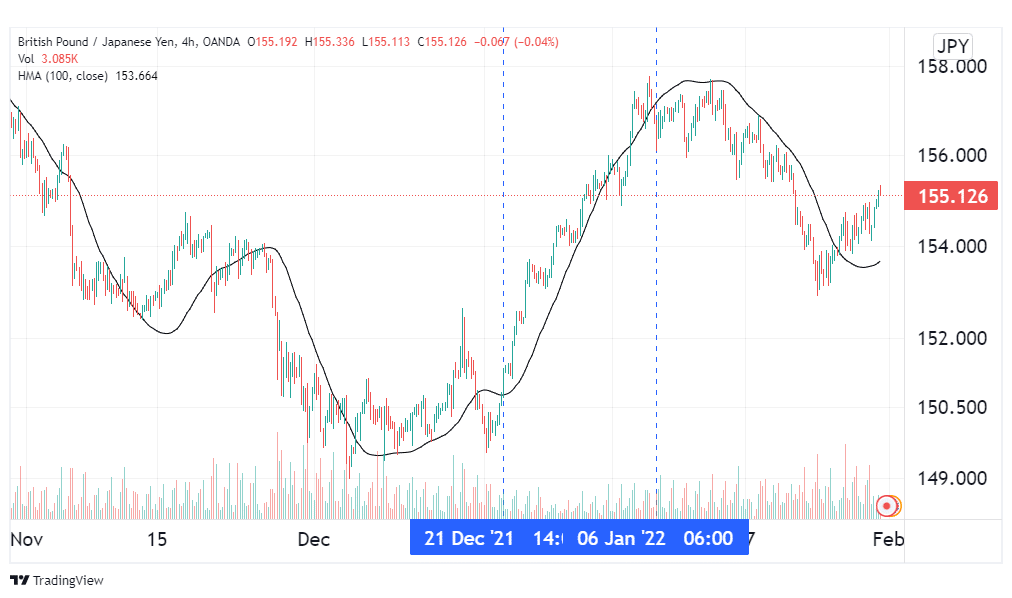
In the chart above, the GBPJPY pair was on an uptrend in the final days of December. This was confirmed by the HMA, which maintained below prices for most of that period. Here, traders would have entered long trades on the 21st when prices crossed above the HMA. A suitable take-profit point came on 6th January, when prices crossed below the HMA, effectively marking the end of the rally.
However, you may notice that HMA gave a number of false signals during that period. Therefore, it is always wise to combine it with other complementary tools for signal confirmation.
2. Crossover signals
First, a disclaimer: since the typical MA crossover signal strategy is based on the lag characteristic, Alan Hull discouraged using the HMA to yield crossover signals. However, many traders who’ve gone ahead to do it anyway have found some success with the strategy. Some of them elect to use HMAs of varying lengths, while others opt to use a cross between the HMA and another MA of the same length.
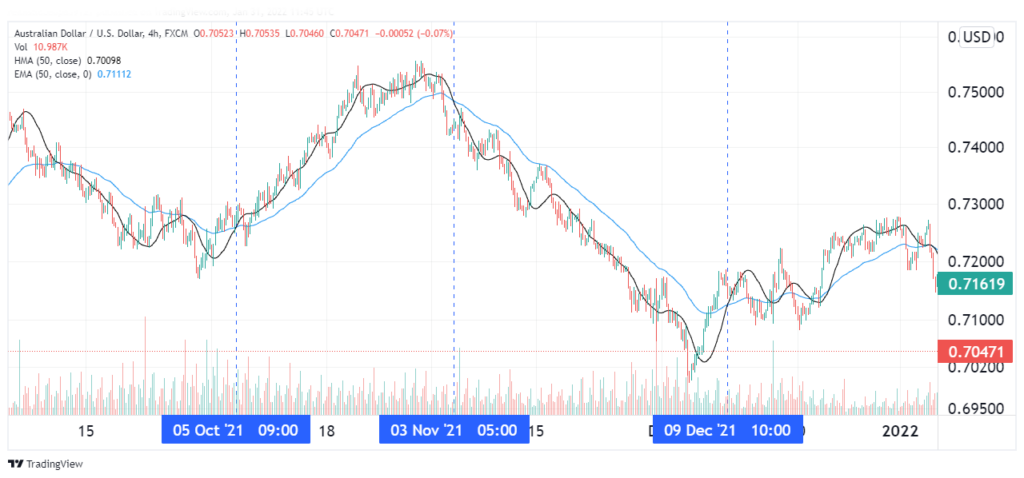
The illustration above shows the crossover strategy using a similar period, HMA and EMA. Whenever the HMA crossed above the exponential MA, the market rallied, which made this signal a bullish crossover. This can be seen on 5th October as highlighted by the blue line. The sell signal was the opposite – HMA crossing below the EMA line. This yields a bearish signal such as the highlighted crossover on 3rd November.
Working example using HMA
Though this tool ranks superior amongst other MAs, it is often not sufficient by its lonesome. Most traders will utilize it in conjunction with other indicators. Some common alternatives include the MACD and Stochastics.
HMA + MACD method
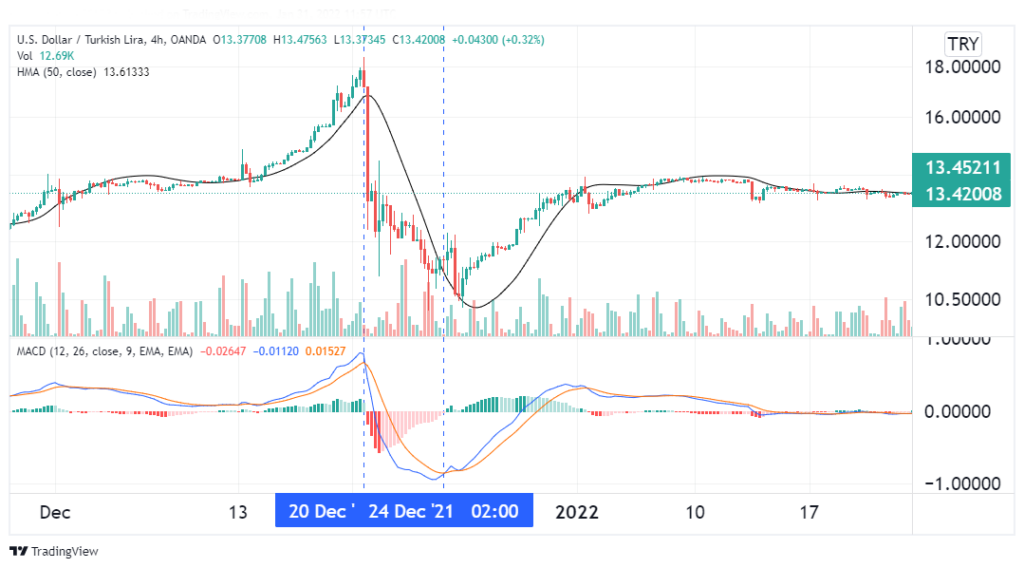
The above chart shows how the HMA and MACD work together in practice. On 20th December, the MACD line crossed below its red signal line, which is a bearish signal. Soon after, prices broke below the HMA, confirming the bearish flag and prompting traders to short the USDTRY. Four days later, a bullish MACD cross manifested, after which prices broke above the HMA. This marked the exit for any open short trades.
MACD + Stochastics method
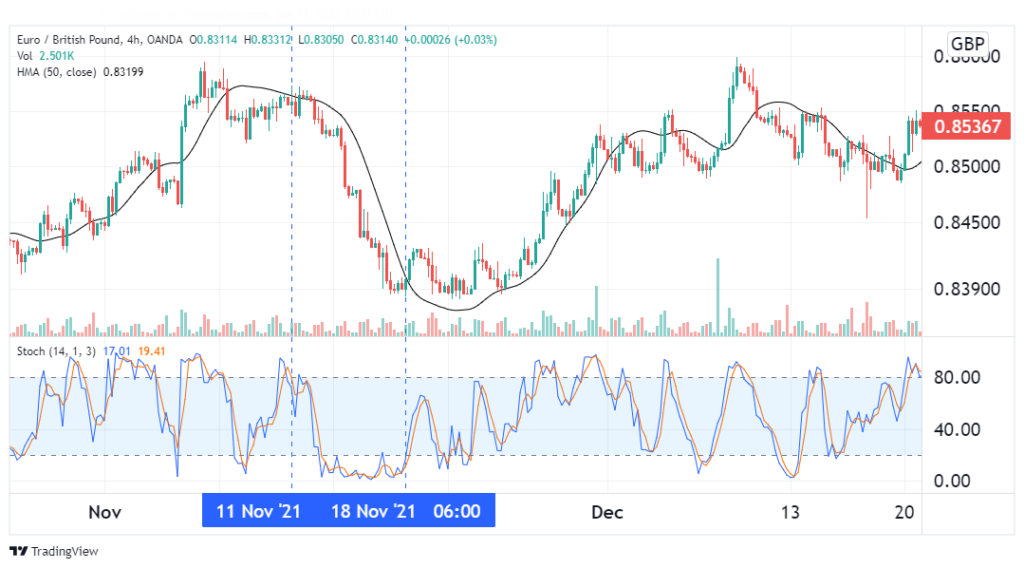
The image above shows the HMA and Stochastic Oscillator combination applied on a price chart. By 11th November, prices had been trending below the HMA for a while after a prior rally. On the 11th, Stochastics showed that the EURGBP pair was overbought, confirming our bear flag. This called for a short on the pair. The exit signal came on the 18th when Stochastics left the overbought region and prices broke above the HMA.
Conclusion
The HMA is an improvement on the Moving Average. It uses Weighted Moving Averages to solve lag while still maintaining a smooth curve. Like other MAs, it can be used to follow trends, as well as identify reversals using crossovers. For best results, it is best to use this tool with other indicators such as the MACD and Stochastics.


