
The ALMA is a new member of the family of Moving Averages (MAs). Arnaud Legoux and Dimitrios Kouzis Loukas designed the ALMA. It has quickly acquired traction in the trading community, and it is now generally recognized across a wide variety of markets. According to Legoux, the Gaussian Filter had a significant impact on the ALMA, and he regularly compares his MA to the Hull Moving Average (HMA).
What is ALMA, and why was it developed?
ALMA was created to overcome two issues with standard MA, responsiveness, and smoothness. A short-term MA is more sensitive, but it can be choppy and cause misleading signals. A long-term MA, on the other hand, is noted for being smoother but lacking in responsiveness, meaning that price moves significantly before the long-term Moving Average catches up. Traders are typically forced to choose between a rapid and responsive Moving Average that is prone to false signals or a long-term smoother Moving Average that is often delayed when it comes to indications.
Technical traders have attempted to defeat this strategy throughout time, which is one of the reasons why you’ll see a lot of two MA methods, in which you have a short-term and long-term MA and trade based on responsiveness and smoothness.
ALMA tries to close this gap, and as a result, it should exhibit both responsiveness and smoothness at the same time. The indicator, interestingly, applies the MA, first from left to right and again from right to left, a technique that is supposed to considerably reduce price lag or phase shift, an issue that is frequent with standard MA.
Let us look at an example in the GBPUSD chart below.
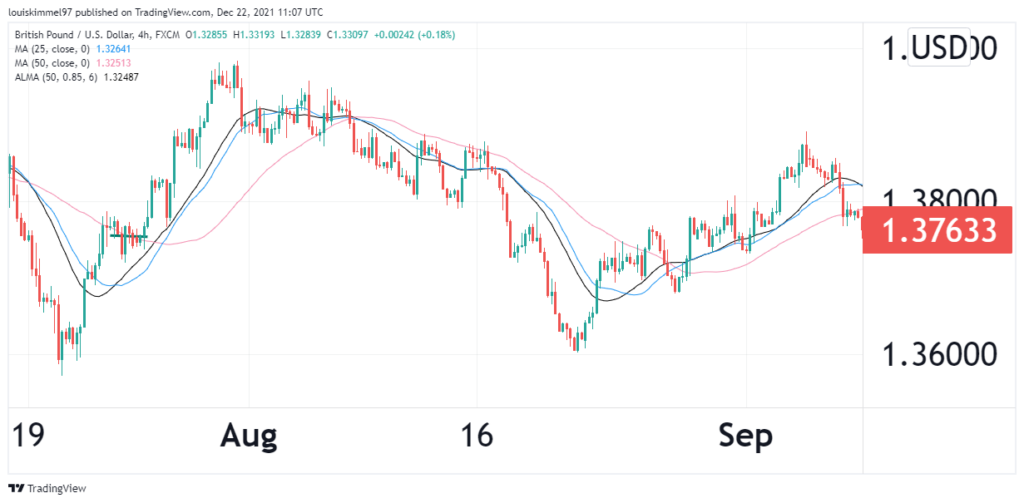
In the GBPUSD chart above, the pink line is the 50-period MA, the blue line is the 25-period MA, and the black line is the 50-period ALMA. I have backtested the three indicators to show the difference. The 50-period is smooth but not responsive, the 25-period is choppy, and the 50-period ALMA is smooth and quite responsive.
Calculation
Formula
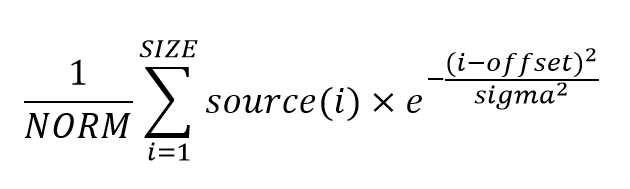
Where,
Size: This is the window size, i.e., the period is this element.
Offset: This is the Gaussian element, which may be aligned to the current price and is applied to the combination line.
Sigma: This component is a standard deviation that is added to the combination line to make it seem sharper.
How is ALMA used in FX trading?
Find oversold and overbought prices
In an uptrend, if the asset price is above the ALMA, it indicates it is overbought prices. During a downtrend, if the price remains below the ALMA, it indicates it is oversold. A stochastic oscillator can also be used to verify this. If the tool is over 80, it indicates that prices are overbought. If it falls below 20, it shows the oversold state.
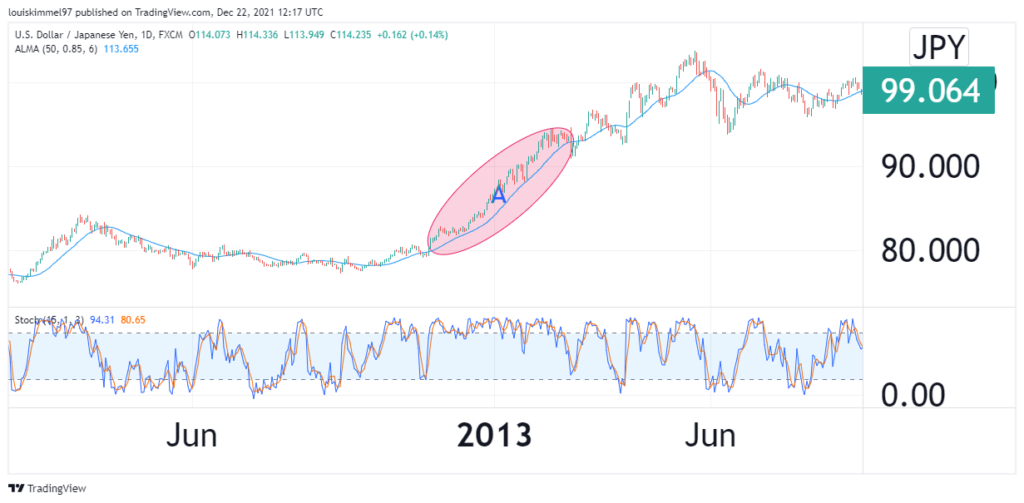
Look at the USDJPY chart above. In the region marked A, the ALMA is constantly below the market, and the stochastic oscillator is above 80. This means that the price in that region is overbought.
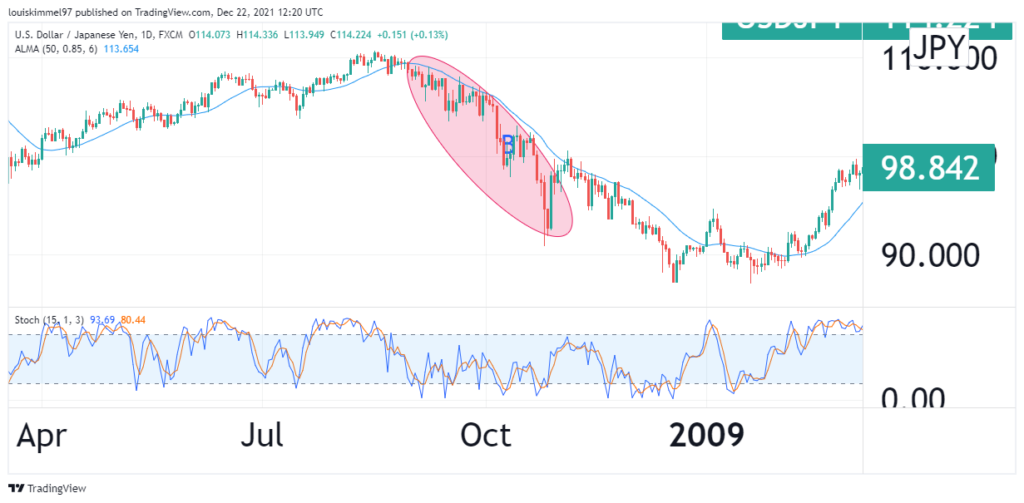
In the region marked B, the ALMA is constantly above the prices, and the stochastic oscillator is below 20. This means that the price in that region is oversold.
How to find entry signals
ALMA and other MAs
You can use a 50-period ALMA, 10-period MA, and 15-period MA. Consider starting a buy position when the 10- and 15-period EMAs intersect, and the asset price is above ALMA. Consider opening a sell position when the 10- and 15-period EMAs intersect, and the price is below ALMA.
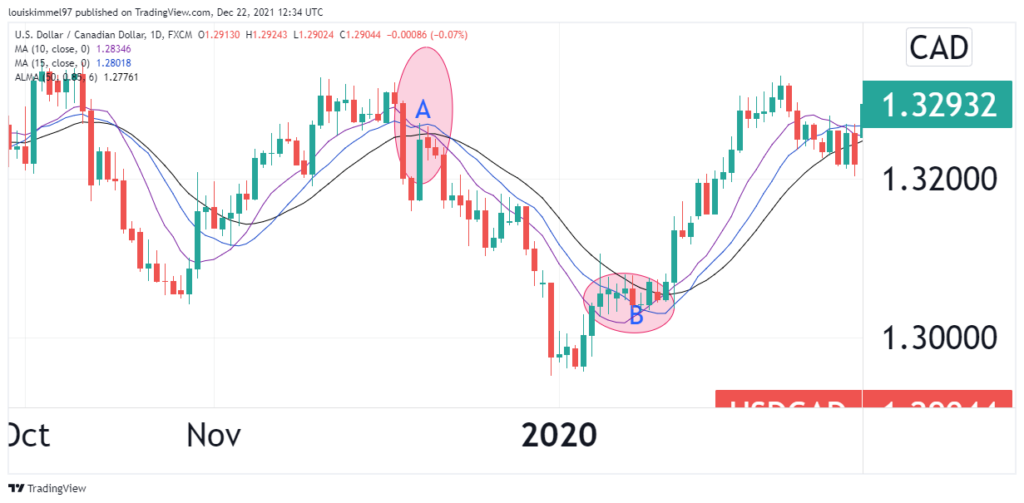
In the USDCAD chart above, the purple line is the 10-period MA, the blue line is the 15-period MA, and the black line is the 50-day ALMA. In the region marked A, the 10 and 15 periods MA intersect, and the ALMA is below the two MAs; thus, a sell position can be opened. In the region marked B, the 10 and 15 periods, MA intersects, and the ALMA is above the two MAs. Thus a buy position can be opened.
ALMA and Bollinger Bands
Bollinger Bands are a leading indicator with two bands, one above and the other below the price. It also has a Moving Average-based centerline. The indicator’s upper and lower bands expand and contract in response to market volatility.
A buy signal is triggered when the ALMA indicator is trending below the price, and prices cross above the middle Bollinger band from below. A sell signal is triggered when the price crosses the middle band from above, and the ALMA indicator rises above the price.
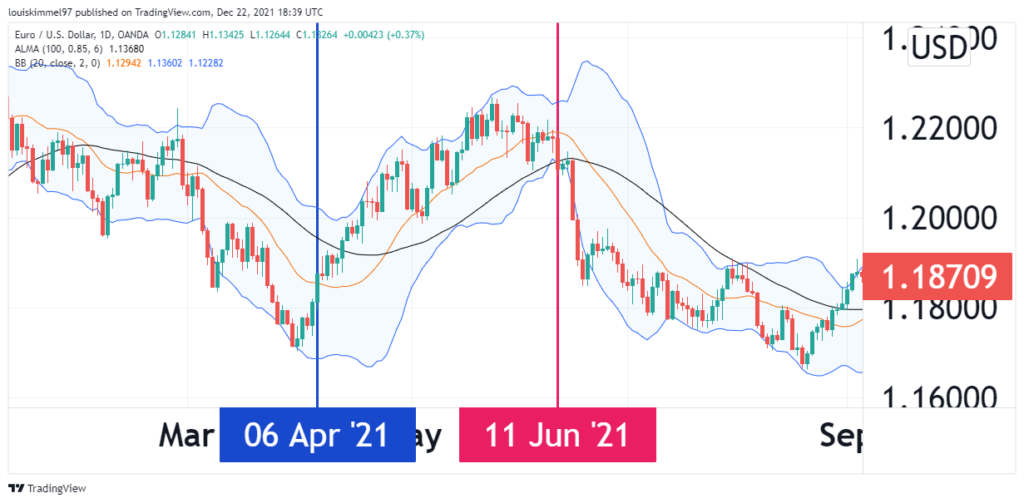
The EURUSD chart above showed the first sign of an incoming uptrend when prices crossed above the middle Bollinger band on April 6. A few candles later, the ALMA moved below the price, confirming our buy signal. The sell signal came a few months later when prices broke below the middle band which they had been using as support throughout the rally. This signal was confirmed when the ALMA indicator crossed above the price bars.
Disadvantages
- While the ALMA is intended to address the shortcomings of traditional Moving Averages, it is still a type of MA that is derived using historical data, thus not very accurate for predictions.
- You cannot rely on it solely. You have to combine it with other indicators for confirmation.
Conclusion
ALMA is an improved MA, thanks to its responsiveness and smoothness. Because of this, it is found in many charting applications. The settings can be customized according to traders’ use. The indicator is widely used, especially in generating buy and sell signals. Like any other indicator, it has disadvantages too.


