
Of the varying indicators that traders utilize to simplify their lives, none is as important to learn and know about as the Stochastic Oscillator. Even though it was brought out seven decades ago, it is still seen in a favorable light by market players across the globe, mainly due to its simplicity and accuracy. In this article, we find out what it is about this measure that traders find so fascinating. So, without further ado, let’s dive straight into the deep end.
What is a stochastic oscillator?
The stochastic indicator relates the closing price of a security to the range of its prices over a set time period. It is highly sensitive to such changes, but it can also be reduced as one adjusts the time periods. The sensitivity can also be adjusted by picking out the moving average. Through it, traders can identify how and when the signals are being interpreted as either overly bought or sold within a range of 0 to 100.
The assumption here is when there is an uptrend that the highs are renewed and increased – the same applies to the lows. This refers to the range within which currencies trade in a session. Correspondingly, the reverse is also true: in a downtrend, both the highs and lows tend to fall, i.e., they become lower whenever renewed.
More often than not, the time mode utilized for the range is the mathematical number 14. This number can represent days, weeks, or even months based upon the goals of the trader. Anyone looking to analyze the trend may want to look at the complete sector. Those who want to have a broader view of the sector would want to start by observing the complete 14 months of the trading range of the whole industry.
However, you can set it to 1 or 4 hours, for example, or even 15 minutes for your convenience.
History
Formulated by George Lane in the 50s, it has never gone out of vogue amongst contemporary traders. As mentioned above, it was designed to represent the point at which the price closes equated to the range over a specific period of time.
Lane has mentioned time and again that his brainchild does not follow the T-things such as volume or price. It, instead, traces the momentum (or the steam) of the price. He also revealed that, as a rule of thumb, the momentum or pace of the price deviates from its path just before the price does. As such, it can be utilized to forecast or bode the reversals when any bullish/bearish deviations are revealed. It is, perhaps, the most relevant and crucial signal that Lane figured out.
How can you use the stochastic oscillator for trading?
The signal generator is bounded within a range from 0 to 100. As such, it is quite helpful in representing conditions when the security is either overbought or oversold. By and large, anything above 80 highlights that the overbought conditions are satisfied while anything under 20 highlights the reverse, that oversold conditions are in place.
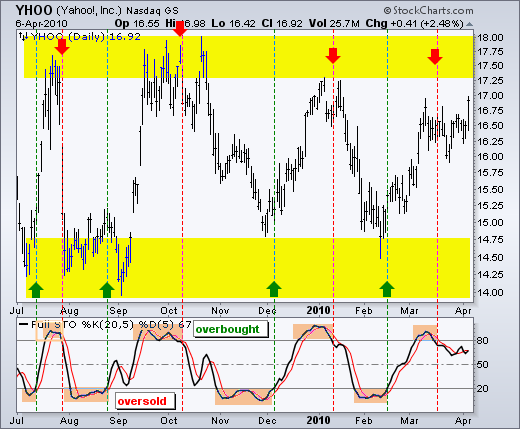
However, it is important to consider that they don’t always bode reversals. Sometimes, strong trends do end up maintaining either condition for a longer time period. So, instead of following it blindly, one ought to keep one’s eyes peeled for clues and hints about changes in future trends.
Its chart constitutes two basic lines:
- One reflects the true value of the indicator for every single session.
- The other reflects the moving average over three days.
Since the price traces momentum, whenever these two lines cross, it is an indication of a reversing of the trend and highlights big momentum shifts from one day to the next.
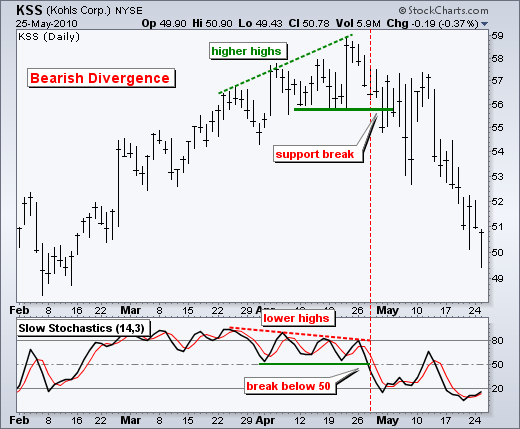
A reversal is also forecasted when there is a deviation between the indication and the trend of the price action. For instance, if a bearish trend has reached a lower low, but the indicator is oriented to a higher low, it could be a hint that the trend is losing steam and a bullish reversal is on the cards. Conversely, when the price has formed a higher high but the indicator is oriented to a lower high, a bearish divergence could well be expected.
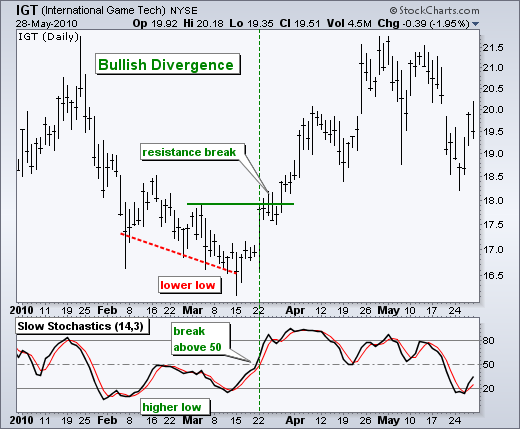
As soon as such divergences emerge, traders ought to look out for clues that confirm the very reversal. A bearish divergence is affirmed by support breaks on the chart or the indicator breaking under 50. On the other hand, a bullish divergence is affirmed by resistance breaks or the indicator breaking above 50. The midpoint of the range, 50, is an important level to look out for to confirm the reversals in trend.
Drawbacks
The main drawback of the indicator is that it tends to develop false signals. This habitually occurs when a trade signal is generated, but the price doesn’t come through, which ends up with a loss. When the market is experiencing unpredictable conditions, such false signals can be generated quite often. One way to get around this drawback is to use the trend for signal filtration so that only those are taken that are in the direction of the trend.
Conclusion
Even with its drawbacks, this indicator is favored greatly by traders due in no small part to its accuracy and simplicity. Both beginners and veteran traders are sure to find it useful if they haven’t been using it already to simplify their trades.
The signals generated can be capitalized on, especially when the reversals are forecasted and traders can accordingly place their trades well before the actual price movements highlight the reversal. However, be careful not to take the signals at face value as many of them can be false, especially if the market is behaving unpredictably. When used in conjunction with other indicators, it can be a useful tool in a trader’s box.


