
Breakout trading is a popular strategy among traders in a variety of marketplaces, not only cryptocurrencies. Active investors utilize breakout trading to enter a trend when it is still in its early phases. In general, this method can be used to initiate big market movements, increase volatility, and, when well-managed, offer low downside risk. However, false breakouts are widespread in the crypto trading market. It’s very common for traders to enter a trade only to see it go against them almost immediately. You can not only avoid being stopped out but also profit from false breakouts if you have a thorough understanding of the price action that precedes such breaks.
What is a breakout?
A breakout occurs when the price of an asset moves above a resistance or below a support level. It may signal that the asset’s price will begin to move in the direction of the breakout. Breakouts with high volumes may be considered a more powerful signal than those with average or low volumes. If the volume is high, the price is more likely to begin trending in the breakout direction.
A trader enters a long position after the crypto price breaks above resistance or opens a short position after the crypto breaks below support. When they trade above a price barrier, volatility rises, and prices respond by moving in the direction of the breakout.
Breakout trading is applicable across different timeframes. It can be used for day trading, swing trading, or any other type of trading.
How to spot breakouts
Chart patterns
Examples of chart patterns include triangles, channels, wedges, rectangles, head and shoulders, cup and handle, and expanding ranges. When the price moves in a given direction, these patterns appear. On the pattern, the trader will usually draw trendlines to show where the support and resistance levels are. When the price breaks out of the pattern, it moves in the direction of the breakout.
Technical indicators
There are many indicators that can indicate a breakout. For example, a triangular pattern could be formed by a relative strength index indicator. If the price breaks out of the triangle to the upside, it could be a signal to buy the crypto asset, or if it breaks lower, it could be a signal to sell the coin.
Fundamental indicators
While there are other approaches for estimating a cryptocurrency’s worth and growth potential, fundamental analysis is one of the most successful. Examples of fundamental indicators include fear and greed, bitcoin dominance, the amount held by whales, and the Stock-to-flow indicator. For example, whales in the crypto world are individuals or institutions who hold enormous amounts of a particular cryptocurrency’s coins. When they accumulate large amounts of coins, they become powerful enough to manipulate the value of a specific cryptocurrency. If a coin’s supply is concentrated in a few wallets, there might be a breakout in the price if those wallets sell.
Exits and stop loss
Predefined exits are an important component of any effective trading strategy. You should consider the cryptocurrency’s recent trend when determining a suitable target price. It is simple to use recent price action to build a price goal when trading price patterns. Using a chart pattern is one of the easiest ways you can find support and resistance levels that can be placed as profit targets.
Another option is to average recent price fluctuations to arrive at a comparable price target. These are some suggestions for how to set price targets as a trade target. This should be your trade objective. An investor can quit the position, exit a portion of the position to let the rest run, or raise a stop-loss order to lock in profits once the goal has been met.
What is a false breakout?
False breakouts are exactly what their nomenclature suggests: a breakout that did not extend beyond a certain level, resulting in a ‘false’ break out of that level. False breakout patterns are one of the most important price action trading patterns to grasp since they are frequently a strong indicator that the price is about to change direction or resume a trend.
A false break of a level can be regarded as a market deception when the price appears to break out but then swiftly reverses, misleading all those who took the breakout’s bait. Amateurs will frequently enter what appears to be an obvious breakout, only for professionals to push the market back the other way.
How to spot a false breakout
Bull and bear traps
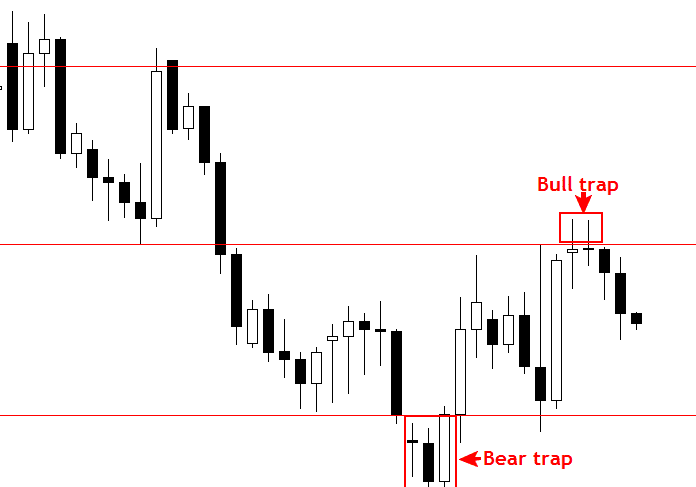
This is a 1 to 4 bar pattern characterized by a false break, which frequently occurs at major market levels. When a market approaches a significant level aggressively, traders expect it to break, so they buy or sell the breakout, only to have the market reverse and construct a bull or bear trap.
Bull traps frequently occur following a move higher. Inexperienced traders enter the market at the important resistance level, believing the market has gained enough momentum to break above it. The market then goes on to break above the level, filling all of the breakout orders just before the market makers come in and push the market lower.
False breakout of consolidation
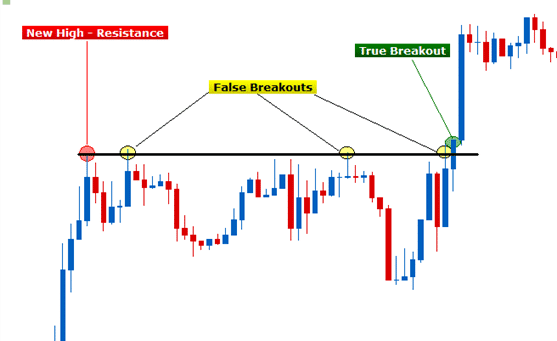
Breakouts like these are regular in the crypto market. Traders are generally misled into assuming a trading range will breakout, only for it to revert back into the range’s body. To avoid getting caught in this trap, wait until the market closes outside the trading range on the daily chart before looking for price action trading signals in the breakout’s direction.
Risk management to avoid making losses in case of a false breakout
Before entering trades, plan your exit strategy and place stop-loss orders.
Limit the amount of money you put at risk in each trade. Many traders won’t risk more than 1% of their trading capital in a single trade as a general rule. Does this imply that they only invest 1% of their capital in a given position? No. It simply means that if the market turns against them and their stop-loss is hit, they will only lose 1% of their trading capital in a single trade.
Using technical indicators
Technical analysts may have very strict criteria for what qualifies as a trading signal in their system. It’s possible that a signal from one indicator isn’t a buy or sell indication in and of itself. If numerous indicators are indicating the same thing, it may confirm the signal’s strength.
Summary
A breakout is when the price moves above a resistance level or below a support level. There are several strategies you can use to spot a breakout and a false breakout. Some trade breakouts, while others look for false breakouts and then trade in the opposite direction. If the breakout fails, they believe the price will continue to move in the other direction.


