
The price of a financial asset, such as a currency pair, is important in trading since it determines whether a trader makes a profit or loses money. Traders interested in price action should use patterns. The setup is frequently regarded as the most reliable of all major reversal patterns. The inverse Head and Shoulders is just as effective in a trader’s portfolio as the standard formation and use the same strategy.
Head and Shoulders (H&S) pattern definition
The H&S chart pattern is a price reversal pattern that helps traders spot when a trend has run its course, and a reversal is imminent. This reversal signals the end of an uptrend. The Inverse H&S pattern has the same structure as the regular formation but with the structure reversed. In a downtrend, the Inverse formation can be seen, which suggests an incoming bullish trend reversal as higher lows are formed.
The H&S pattern has a particular appearance that resembles its name. It has a distinct uptrend, left shoulder, head, right shoulder, and neckline arrangement.
H&S uptrend
The uptrend is the initial phase of an H&S pattern. This is the prolonged upward movement that leads to weariness. The longer an uptrend has been in place, the more significant the reversal is likely to be.
H&S left shoulder
The market continues to fall in order to make a higher low. Things are starting to come together at this stage, but we still don’t have enough information to draw the neckline.
H&S head
The market now makes a higher high, becoming the head, after the left shoulder has formed. Despite the bullish rally, however, purchasers have been unable to create a much higher low. We have the left shoulder and the structure’s head at this point. The design of the neckline
H&S right shoulder
Things come together on the right shoulder. It’s a sign that buyers are getting tired of the market and that it’s about to turn around. We can begin plotting the neckline as soon as the right shoulder begins. However, because the pattern isn’t finished, it’s best to consider it a rough draft rather than a finished product.
H&S neckline
We can draw neckline support now that we have a distinct head and two shoulders. Consider the neckline as a dividing line between buyers and sellers.
Applying the Head and Shoulders pattern
Breakout
The H&S breakout is the indication we need to start a short position. We need to observe price activity break through the pattern’s neckline to get a valid Head and Shoulder breakout. A short signal for the H&S setup is triggered when a candle closes below the neckline of the right shoulder.
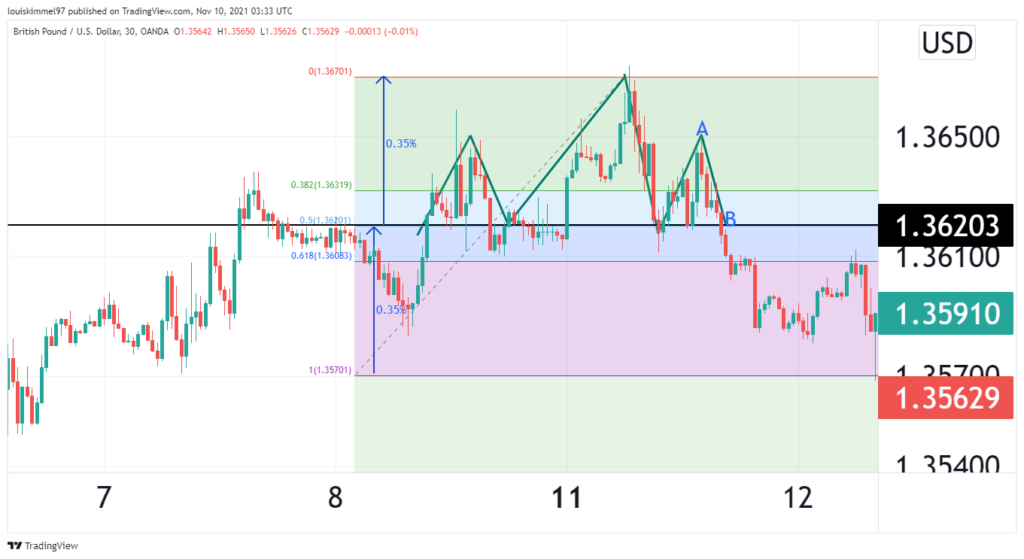
In the GBPUSD chart above, the breakout point is marked B. This is the point just after the candle closes below the neckline in the right shoulder.
Stop loss
A stop-loss order must be employed in the H&S trade setup. This is to minimize the loss. The best spot to set your stop-loss order on the chart is above the second shoulder. When you short a currency pair after an H&S breakout signal, you set your stop loss above the pattern’s third top.
In the GBPUSD chart above, the stop loss should be placed at the point marked B. This is above the pattern’s right shoulder.
Price target
The potential target for the trade is highly dependent on the size of the Head and Shoulders formation. Take the distance between the tip of the Head and the neckline to determine the height of the pattern.
Once you’ve determined the height of your H&S pattern, work your way down from the first breakout through the neckline. When trading the setup, you should expect this price movement. In other words, the projected price move after the head & shoulder pattern is equal to the pattern’s height.
In the GBPUSD chart above, the distance from head to neckline was 0.35%. The price target should be 0.35% from the neckline downwards, as indicated in the chart. You can also use Fib retracement and ensure that the distance from the head to the neckline is 0.5 Fib retracement level, and the take profit should be at 1 Fib retracement level.
Applying an Inverted Head and Shoulders pattern
There is a bullish version of the H&S pattern – the inverted one. The inverted pattern develops during a bearish trend, in contrast to the top pattern, and it indicates that the current bearish trend is likely to turn.
This design is similar to the standard Head and Shoulders; however, it is reversed. As a result, the inverted setup is formed on bottoms rather than tops.
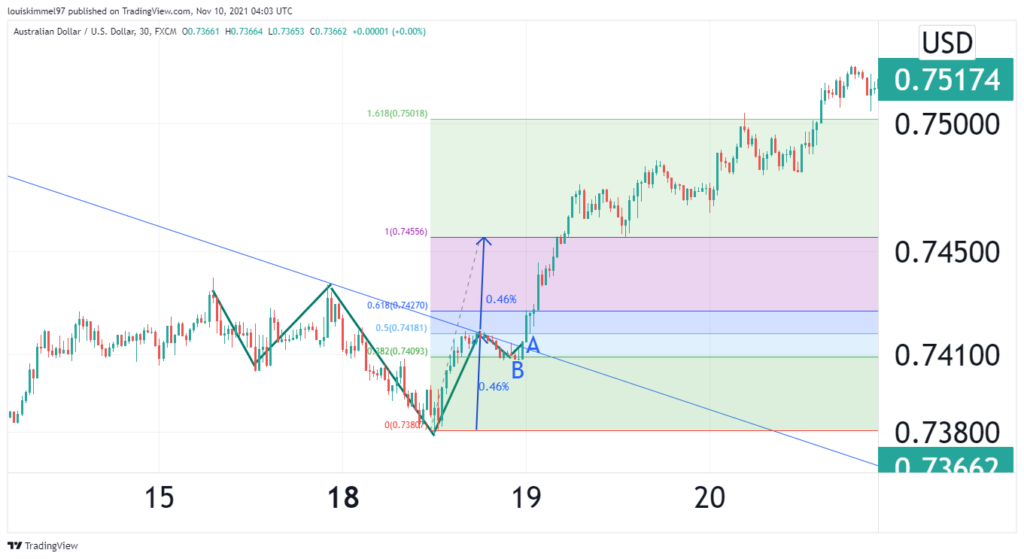
In the AUDUSD 3hour chart above, the breakout point is marked B in the chart. This is the point just after the candle closes below the neckline in the right shoulder. The stop loss should be placed at the point marked A. This is above the pattern’s right shoulder.
The distance from head to neckline was 0.49%. The price target should be 0.49% from neckline upwards, as indicated in the chart. You can also use Fib retracement and ensure that the distance from the head to the neckline is 0.5 Fib retracement level, and the take profit should be at 1 Fib retracement level upwards.
Conclusion
The H&S is the most reliable setup in the forex market when it comes to the win rate. H&S can be used to determine the breakout, stop loss, and target price. The inverse formation uses the same concept as the regular one.


