
Several traders use complex heuristic signals and chart patterns while conducting their trades. But these are generated when the price of the stock moves, and as such, there is a natural delay while using such systems. But if you wish to understand the trading fundamentals, it is advisable to gain some knowledge regarding price action.
What is price action?
It is defined as the movement of price over time for a financial asset. Price action based schemes allow traders to examine price history for clues that can tell them in which direction the market is heading. In this regard, raw price charts help a trader to interpret the way the price moves over a certain interval of time.
These raw price charts are devoid of indicators, i.e., mathematical formulas that tell the traders about the ideal time to conduct trades. Analyzing price action is not just a simpler process, but it also allows for greater accuracy. This is because it allows you to study the price movements created by economic variables, thus saving you a lot of time that would otherwise have been spent on analyzing several variables.
How to use price action
Individuals interpret price actions using charts where the value of the currency is plotted over time. In order to better detect breakouts, reversals, and trends, they use a wide variety of charts. When it comes to visualizing the fluctuation in prices, candlestick charts are the most preferable.
By studying repeating patterns, you can judge whether the market sentiment is changing or continuing in the same direction. Recognizing these patterns lets you determine in which direction the currency price is moving.
The strategies for trading in price actions are as follows:
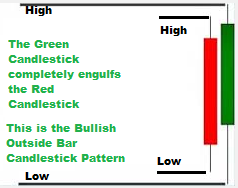
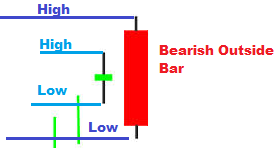
- The outside bar at support and resistance. Many traders are not familiar with outside bars. An outside bar can be termed as bullish when the lowest point of the particular day exceeds that of the day before, but in spite of this, the stock closes at a point that exceeds the highest point of the last day. A bearish outside bar would consist of a similar setup, with the price action being opposite.
- The hammer. This pattern signals a bullish market reversal. Traders mostly use this kind of pattern in a market that is trending upwards. The appearance of a hammer candle is as given below.
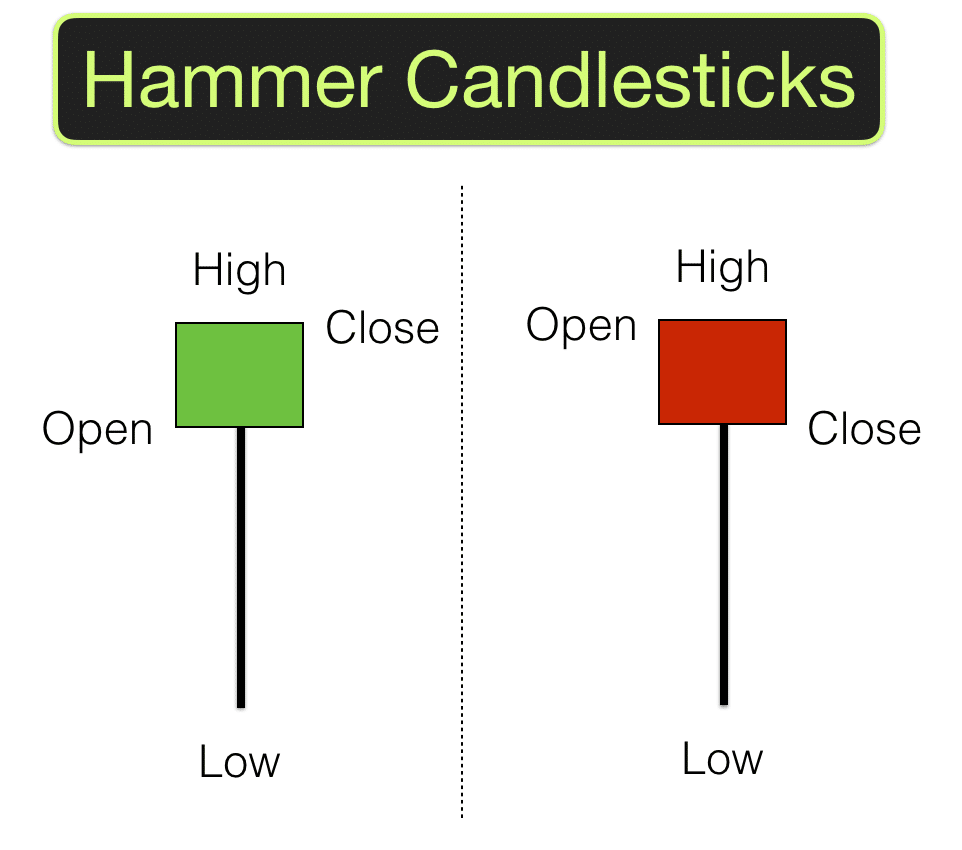
The hammer indicates that the sellers are taking the market to an all-time low position. But, the inability of the sellers to linger at this position forces them to bail out. As a result, the market rallies back upwards, and top buyers enter the scene. The candle’s upper part contains both the price levels that are opening and those that are closing. Normally, the closing level can be situated below the level of opening, but if the level of closing is situated above, then it means that the signal is much stronger.
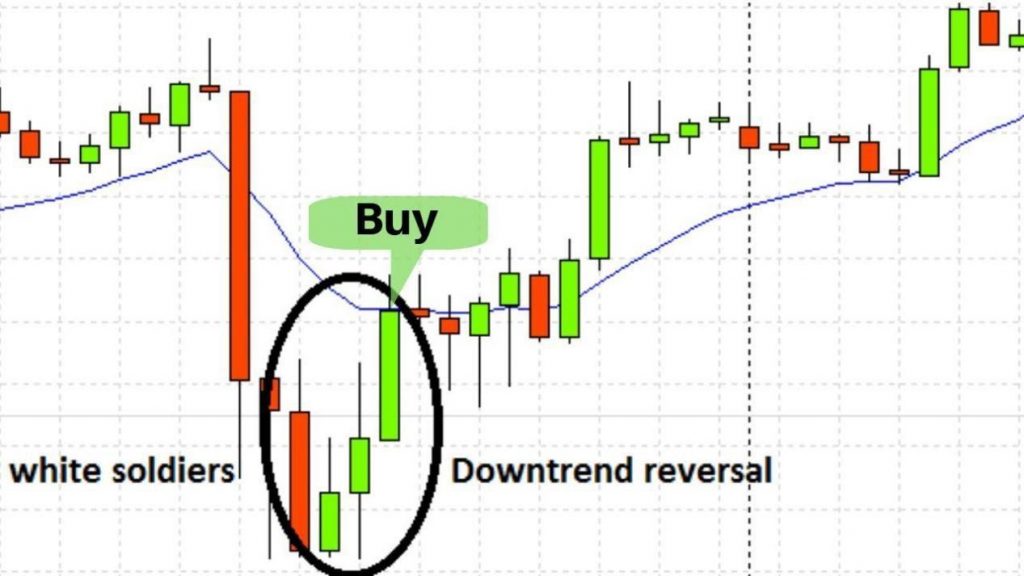
- Common bulls and bears: You can analyze price chart data using a few known trends. The foremost among these is Three White Soldiers, a pattern showing uptrend and consisting of three shapes, white in color, lying side by side. It suggests that the investor attitude can change strongly in regards to the financial instruments that constitute the chart’s price action.
Another notable bearish pattern is the Three Black Crows, which can foretell uptrend reversal.
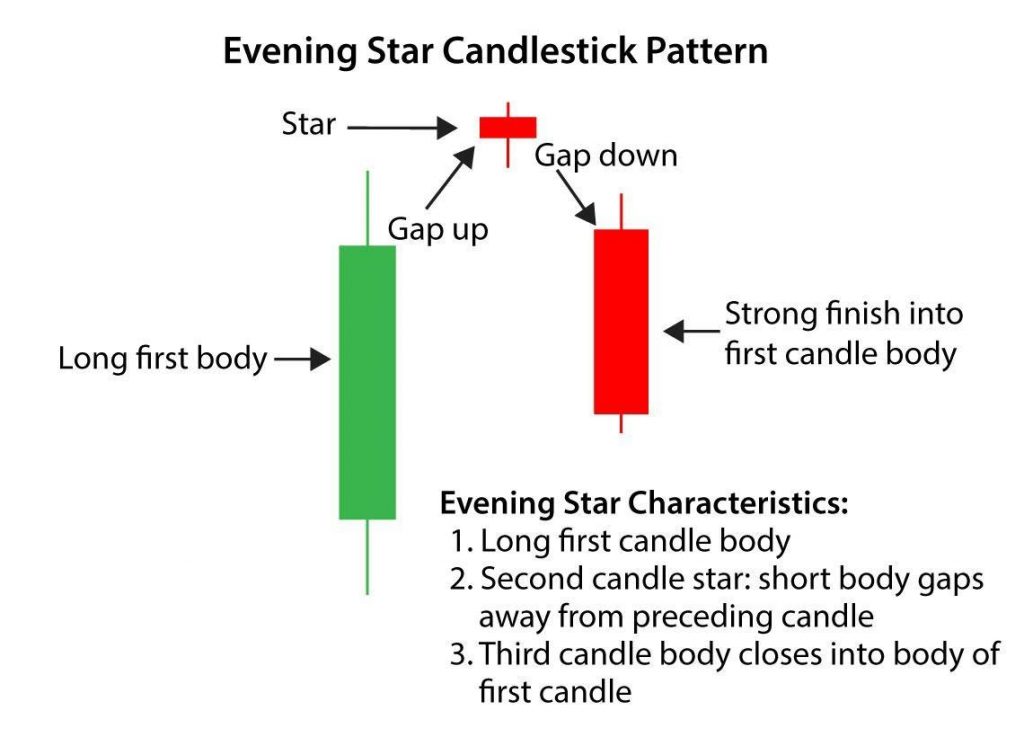
Then, there is the Evening Star, where three candles form a bearish pattern. Out of these three, one is small, one is large, and the other one is red. Traders often use this pattern as an early indicator of uptrend reversal.
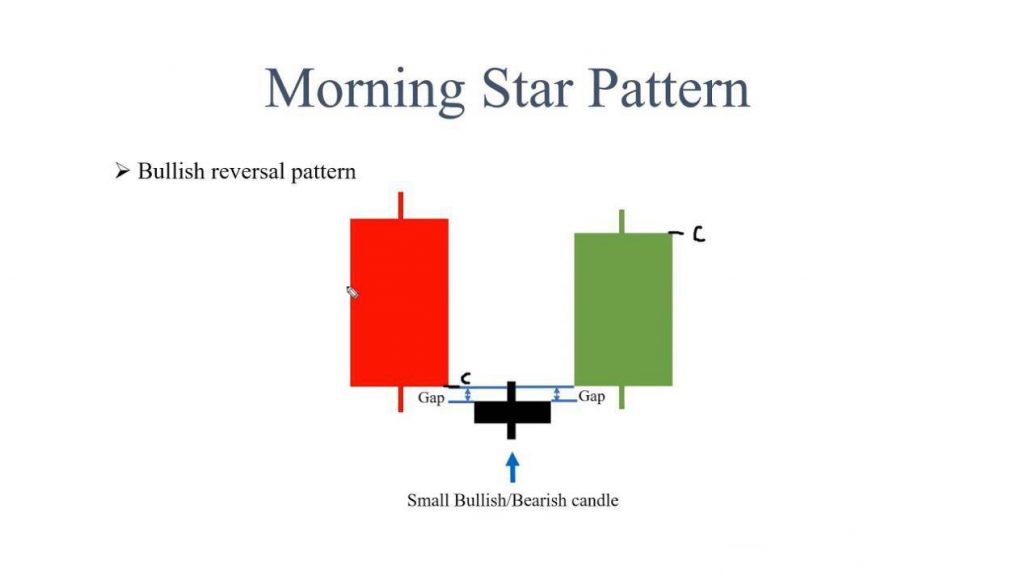
The Morning Star is another pattern that can be seen commonly after a downtrend. This specific pattern marks the beginning of an up-trend.
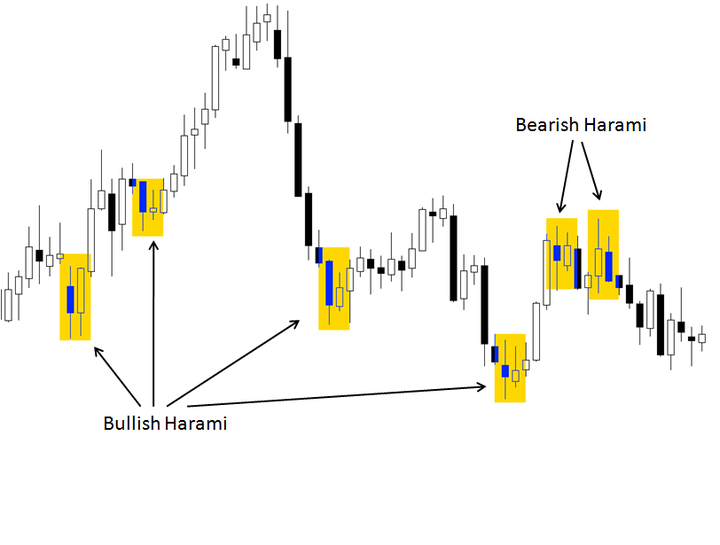
Finally, there is the Harami pattern, consisting of two candles that exhibit market indecision. Breakout trading can be achieved using this pattern, where a bearish harami indicates downside breakdown, while the bullish one indicates market indecision leading to an upside breakout.
Drawbacks of price action analysis
Here are some of the biggest drawbacks of price action analysis.
Fewer trades
It takes a lot of patience to trade in price actions. The main reason behind this is the waiting time for resistance and support confirmation. While waiting, several trading opportunities can slip through the fingers of traders. However, this problem can be overcome by trading without confirmation.
Before trying this in the actual market, it is advisable that you try it on a demo. As an alternative, you can trade in niche markets like equities, futures, and currency pairs.
Waiting for the levels
A trader dealing in price actions usually waits for their levels, which could be resistance or support, or support that previously used to be a resistance. But when it’s a trending market, the presence of an underlying impetus often prevents the price from coming back to the levels.
What a trader should do in this case is drill down into a time frame lying at a lower level to seek out opportunities for trading.
Bad stops placement
As a best practice, traders position their stops right beyond the candle’s high and lows. But more often than not, the stop positions are too obvious, and they are easily guessed by the dealers. This may cause unnecessary roadblocks to appear in your trade while watching the prices changing favorably.
In order to prevent this, traders should position the stops at a fair distance away from resistance and support.
Closing thoughts
Thus, we learned in detail about price action trading and how you can use it to technically analyze a stock or a commodity. Price action presents a whole picture of the market’s opinion regarding your currency pair. Nevertheless, you should have some measures for risk management while trading in price actions.


