
The rising wedge pattern depicts an ascending trend line in prices forming a triangular convergence. It is formed from two lines beginning from a high price point to a higher high where the two meet or intersect to complete the wedge pattern.
In an upward breakout, these up-sloping trend lines lead to a bullish continuation pattern. When the breakout is downward, the ascending wedges will initiate a bearish reversal in the short term.
Long patterns or those that take a while to form have the best performance rate in terms of price prediction as compared to those that take a shorter time. In the case of stock, they may take up to a year to form while forex takes months or weeks depending on the fundamentals.
Identity guidelines
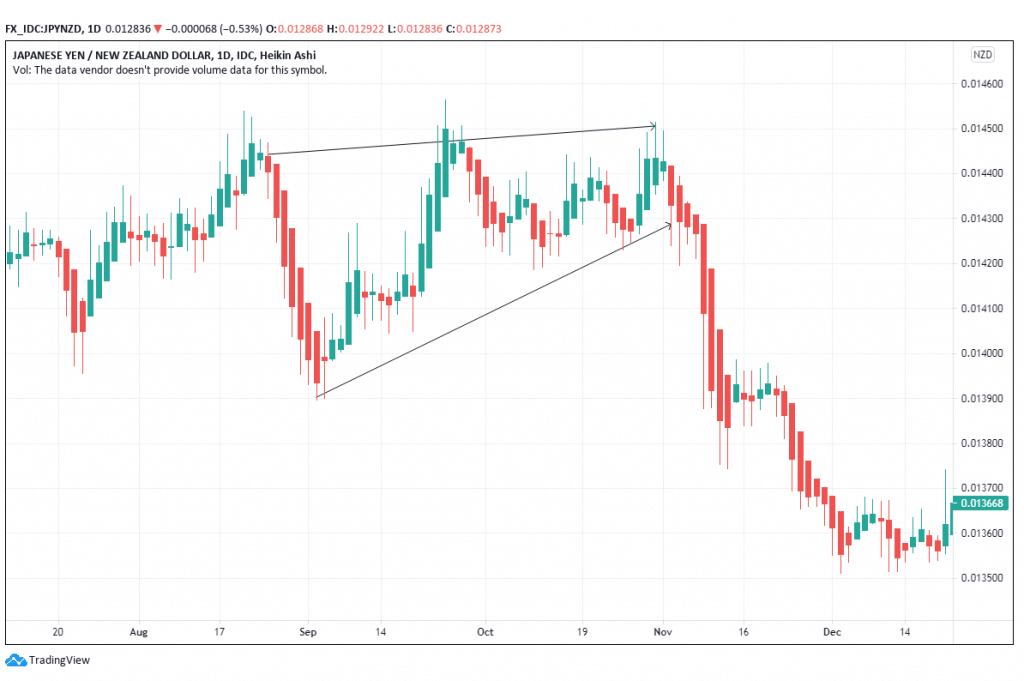
Figure 1: A rising wedge spotted in JPY/NZD pair
- Prior down-sloping price
The two trend lines that form the rising wedge first emanate from a prior decline in prices. The decline can occur within a day or several days as long as it makes a near-vertical move downwards.
In figure 1, the wedge was formed after prices declined continuously from August 25, 2020, to September 3, 2020. Prices dropped 2.08% from 0.0144 to 0.0141. On September 4, 2020, prices later increased from 0.014 to the same 0.0144 on September 28, 2020, before the downward breakout was realized.
- Two up-sloping price trend lines
Two up-sloping trend lines take the shape of an ascending wedge or triangle. The two lines share a downward trend line — one at the top — minor high, the other at the bottom, minor low.
The two lines move upwards and may intersect if the trader wishes to extrapolate the lines further. The upper price line may indicate a decline while the bottom line shows an uptrend. In figure 1, both price lines move upwards until they converge.
- Boundary touchpoints
The rising wedge touches various boundary points as it ascends in the uptrend. The upper trend line may touch at least three points while the lower line may touch two. The best wedge has at least 5 touchpoints.
In figure 1, the wedge touched 5 points in the up-trend and 5 points in the downtrend. The touchpoints are crucial in substantiating the strength of the wedge pattern. If the formation does not have adequate touchpoints, it may be accurate in its prediction of the price movement. It may also expose the trader to a false breakout.
- Three-week minimum wedge formation period
The rising wedge pattern takes at least 3 weeks (21 days) to form from the prior price decline to the breakout price. If it takes less than 3 weeks to form, then it qualifies to be a flag or pennant as opposed to a rising wedge.
In figure 1, the rising wedge is formed from August 25, 2020, to November 3, 2020 (more than 60 days or 2 months during formation). This period is sufficient to establish the wedge as a true pattern.
- Volume trend
The volume dictates the breakout pattern. If the volume increases along with the progress of the wedge formation, the pattern is likely to form a downward breakout. But, if the volume recedes with the progress of the rising wedge, it is likely to cause an upward breakout. The upward breakout will then lead to a bullish continuation.
In figure 1, volume increases as the wedge rises. This increase is followed by a downward breakout. Prices decline to cause a short-term bearish reversal. Wait for the breakout before trading.
Trading strategies
- Define the entry point
Enter the trading at the position close to where you began drawing the wedge diagram.
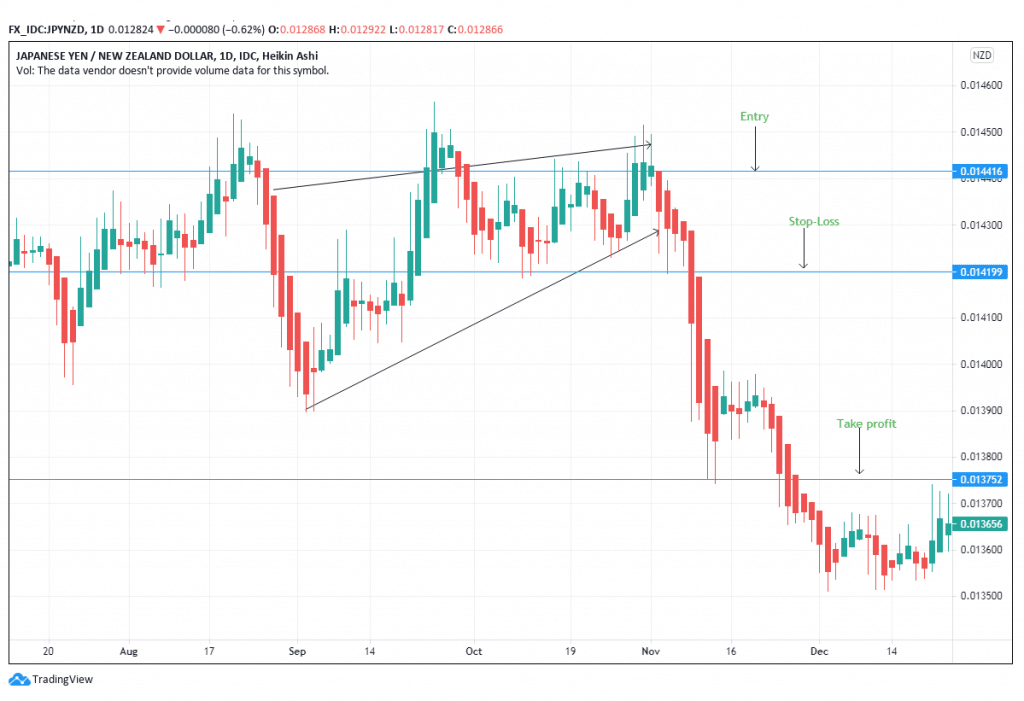
Figure 2: Trade positions for JPY/NZD
In figure 2, the wedge pattern leads to a downward breakout. Here, the trader will prepare to enter the trade in a sell-position as the price is likely to decline. The entry point has been marked by the downward breakout. In our trade, we will initiate the sell trade at 0.0144.
Due to the strength of the wedge pattern our trade is likely to hit more than 50 pips if we trade for several days after the breakout. Also remember, that every single trade uses a maximum of 3% of the funds in the trading account.
Our target price is at 0.0138 based on the price decline from the prior price trend line. The price marked 0.0138 is the exit point of the take profit section that will allow the trader to get the targeted profit in case the trade follows a downward movement.
- Stop loss
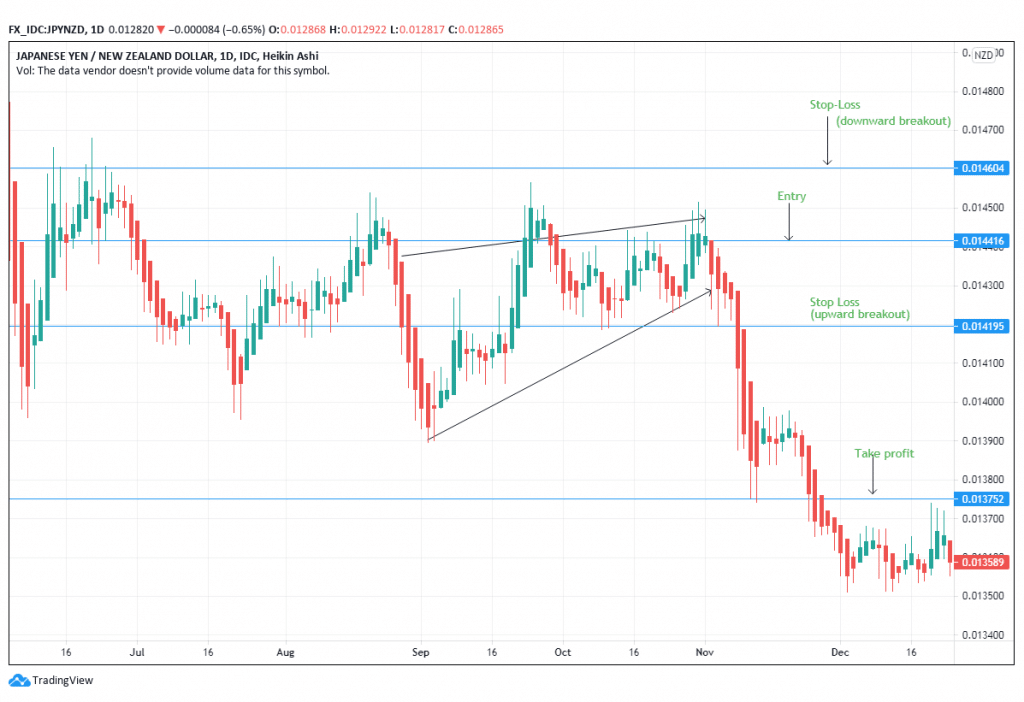
Figure 3: Stop-loss positions
Place the stop-loss at least 20 pips above the breakout point. In the case of an upward breakout, the stop loss should be placed 20 pips below the breakout point. Prices may move towards a correction point. In the case of figure 3, the stop-loss has been placed at 0.0142 (20 pips) below the entry point.
In the case of a downward breakout, place the stop-loss at least 20 pips above the trade entry point. Figure 3 shows that the stop loss has been placed at 0.0146. The trade may continue with the bullish continuation, especially if the wedge was formed after a short time.
You have the liberty to move the stop loss as the trade favors your prediction. Take note of any retracements that may change your mind during the trading process.
Close the trade immediately the price hits your target. In figure 3, the downward movement has continued even after the price reaches the target. Quick moves help to solidify the wedge formations.
Conclusion
The rising wedge pattern is followed by a downward breakout. Sell the asset or forex pair immediately after spotting the breakout point — mark out the entry, stop-loss, and take-profit margins before initiating the trade. Ensure the formation of the wedge occurs in not less than three weeks to make a successful trade prediction on the downside.


