
Ascending triangles in a trading chart are triangular-shaped patterns with an up-sloping bottom and a horizontal top. In an upward breakout, it indicates a short-term bullish reversal. When the ascending triangle has a downward breakout, the pattern outlines a short-term bearish continuation.
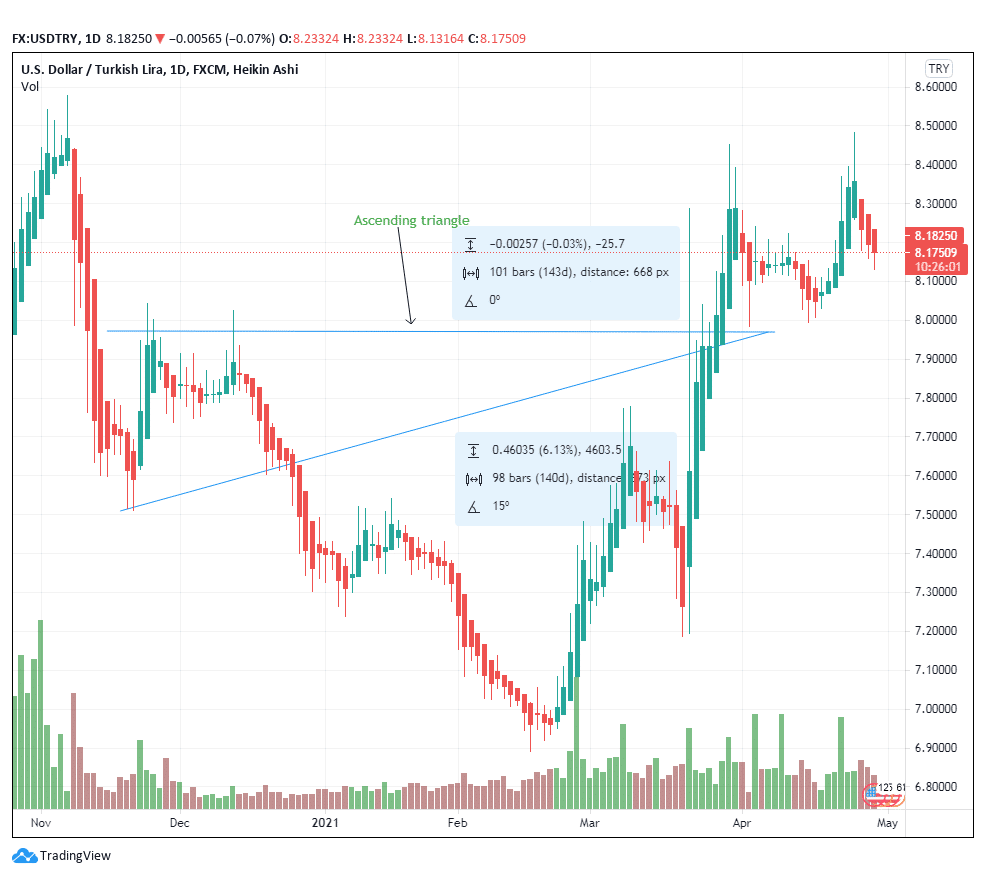
Figure 1: Ascending triangle on the USD/TRY pair
In regards to short price movements, ascending triangle patterns with downward breakouts have the highest success rate. Performance for both upward and downward breakouts is disrupted by pullbacks. It is also better when the daily breakout does not have a gap. Long triangles have better performance as compared to short ones, especially for upward breakouts.
Market occurrence
An ascending triangle in a trading chart is formed by connecting the horizontal trendline, drawn from joining the minor highs with the minor lows. The up-sloping trend line slants and becomes horizontal so that it can link with the lower trend line joining the minor lows.
There is often a premature breakout when volume increases before the actual breakout. In a bullish formation, the pattern boundaries are marked by a horizontal top line and an up-sloping trend line.
This formation occurs as a consequence of selling and buying action among influential traders. In figure 1, the two trend lines meet at the triangle apex. The horizontal top-line touches two minor high points before it reaches the breakout region. The lower up-sloping trend line also touches two minor low points from November 2020 until it joins the topline at the apex region.
Volume recedes as the ascending triangle takes shape,, indicative of lower price movements until the pair reaches the pattern’s reversal point. Figure 1 indicates the pair forms a bullish reversal slightly before March 2021.
In figure 2, the breakout scenarios have been elaborated to illustrate the bullish reversal happening on the USD/TRY trading pair. Volume gradually peaks from January 18, 2021, through to early March as the pair experiences a premature breakout. It is termed premature because the price action is not altered strongly. Traders should be careful in spotting this breakout because prices quickly fall after the pair begins showing bullish signs. Do not trade long until you spot the actual breakout.
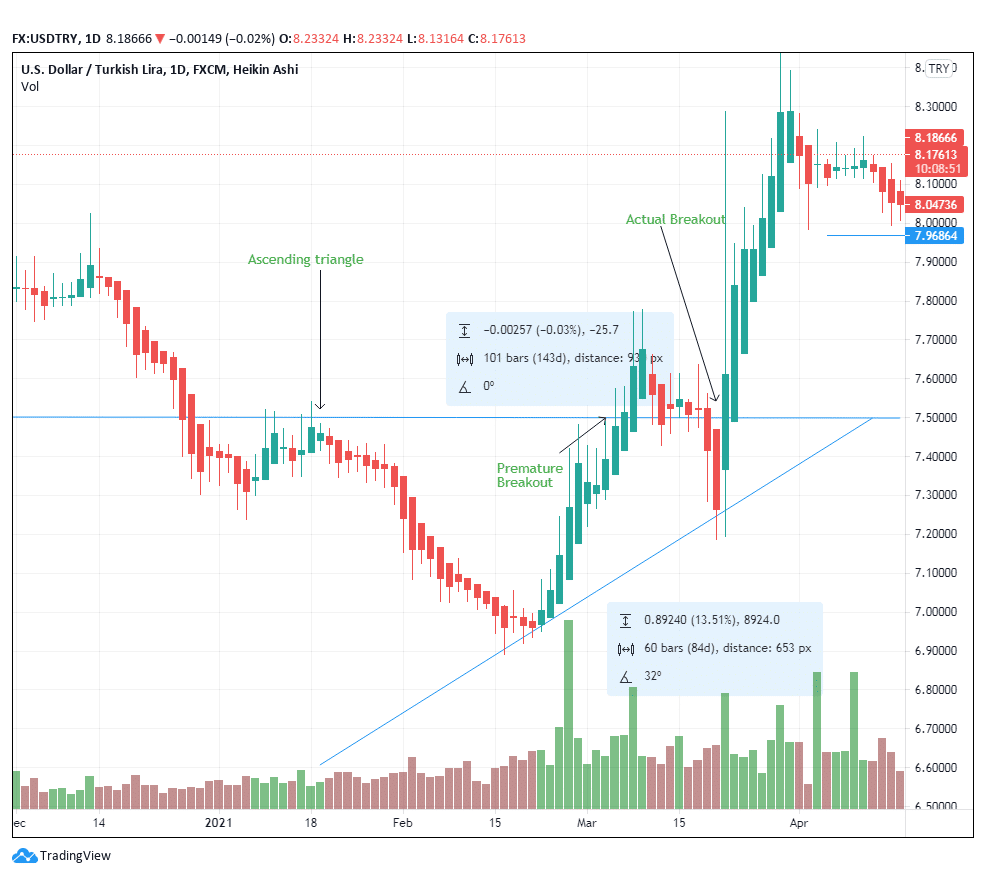
Figure 2: Breakout scenarios in the USD/TRY trading pair
While the breakout points in figure 2 may seem to occur in similar positions (i.e. 7.5000 — the actual breakout is higher at 7.6000. The actual breakout is used as a confirmation line slightly above the area marked as the premature breakout.
The ascending triangle occurred after the USD/TRY pair’s price hit 7.5000, and traders felt the need to sell it due to a stronger Turkish lira as opposed to the US dollar. The declined until it reached 6.9000, the point where the ceiling was put to the selling action. Buying demand resumed at this point until the pair reached support again at 7.5000. More traders entered the market, and the pair’s price continued to surge post-breakout. Buying pressure extends the turnaround until the pair reaches a high of 8.2559 as of March 31, 2021.
Identity Procedures
- The ascending triangle forms an apex
The top trend line rather than ascending takes a horizontal position as the bottom line slopes upwards. The ascending feature of the bottom trend-line is the pillar of the pattern as opposed to the top line.
The bottom line shows an increase in prices, while the horizontal trend line indicates resistance/support level. In a downward breakout, the horizontal line will depict resistance, while in an upward breakout, it will depict a support zone. In the case of figure 2, the horizontal line shows a support zone at 7.6000.
- Minor highs
Figure 2, shows that the top trend line touches four minor highs before reaching the premature breakout point. These high points support the horizontal trend. The bottom trend line is supported by four minor low points. When an ascending triangle has the same number of touchpoints (from minor highs and lows), it indicates that the price movement is ready for a breakout.
The crossing patterns also indicate the upward breakout as the price points meet at the apex. The trader should avoid cutting off the price patterns and simply calling it an ascending triangle before establishing how it touches the minor highs/lows.
- Volume
The volume pattern changes from the beginning to the end of the ascending triangle. In most cases, the volume recedes, especially when preparing for an upward breakout. The volume will increase gradually as the pattern forms a downward breakout.
In a premature breakout, the volume will also be high as the price action gains momentum. As of February 22, 2021, prices rose (2.61%) from 6.9814 to 7.1638 on February 25, 2021, when the pattern had the highest volume. The volume continued decreasing after that as prices gained strength until the sudden increase on April 5, 2021, which indicated a slight retracement.
Trading style
- Identify the target price
Use the measure rule to identify the target price. Compute the length of the top trend line from the first minor high point touched until the breakout. You can use the premature breakout as the finishing point. Add this difference to the breakout point.
- Wait for the confirmation price
The trader should be patient until the actual breakout occurs before initiating the trade. Only sell or buy after identifying this point. In a downward breakout, sell the trading pair and buy it in an upward breakout.
- Stop-loss
Use a stop-loss in case you decide to short or buy the stock. Put the stop-loss at most 20 pips above the breakout point in a downward breakout and 20 pips below the breakout in an upward breakout.
Conclusion
The ascending triangle mostly depicts an upward breakout, but it can also usher in a downward breakout depending on the price action. The top trend line moves horizontally while the bottom trend line ascends. The trader should watch the touchpoints as they are vital in identifying the target price.


