In forex trading, a strategic approach is required to get a clear advantage and consistently generate profit. Fundamental and technical analysis are the two major methods utilized in financial markets.
These two analytical methods differ in various ways, including how they work and how they are carried out, the time range they utilize, the instruments they use, and their goal. Both methods are also the subject of critical reviews by the academic and scientific communities, with many of these reviews focusing on application methods, such as the possibility of combining the two analyses and using them in conjunction to fully exploit their strengths and advantages.
Technical analysis
Technical analysis is a method of predicting a currency pair’s future market price based on past performance statistics. It looks at how a currency pair’s price has changed in the past and tries to anticipate how it will change in the future. After all, history repeats itself.
On a price chart, technical analysis entails recognizing patterns and using indicators to predict the direction of a trend. Wedges, double tops, descending triangles, and flags are some examples of price patterns that forex traders look for. Such a trader will then use indicators to determine the entry and exit points, all of which differ depending on the setup in question.
A technical forex trader will also need to evaluate things such as the price movement, trend, support, and resistance levels. Further, they’ll apply indicators such as the Moving Average, the RSI, or the Average True Range indicator. The good thing is, many of the patterns employed in this analysis can also be applied to other markets. Therefore, to achieve the best results, you would be wise to combine both chart setups and indicators.
The example below shows a sample technical analysis done on a EURUSD price chart.
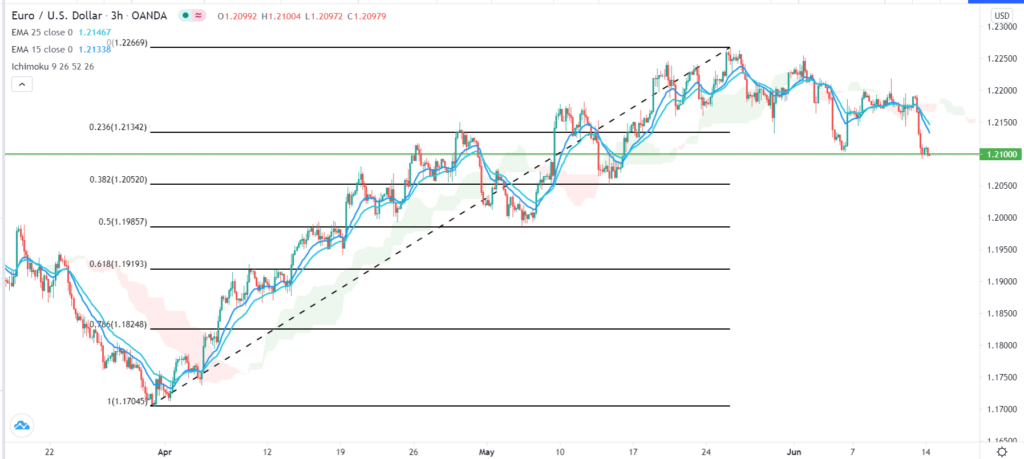
A bearish trend has been emerging lately. For one, the pair seems to have been forming a head and shoulders pattern, which is usually a bearish signal. The pair has also dropped below the 23.6% Fibonacci retracement level, while the 50-day and 25-day Exponential Moving Averages (EMA) have formed a bearish crossover pattern. Further, the pair has moved below the Ichimoku cloud, which is usually a bearish signal.
Fundamental analysis
This entails evaluating a country’s economic strength and, by extension, its currency’s value. Using this analytical method involves examining various economic aspects. It does not account for changes in currency prices.
In its stead, fundamentalists employ certain data points to gauge a currency’s strength.
A typical currency analyst will look at the country’s inflation, trade balance, GDP, employment growth, and even the average interest rate set by the central bank. Different data affects currencies with different magnitudes. For example, GDP, CPI, and PPI have a strong effect on a currency, and the currency can either become bullish, bearish or reverse when this data is released. Fundamental analysis is predicated on the premise that fundamentals have a time delay in affecting prices.
There are different websites on which you can access an economic calendar. The economic calendar displays scheduled economic events from different countries the world over. Look at the example of a calendar in the illustration below.
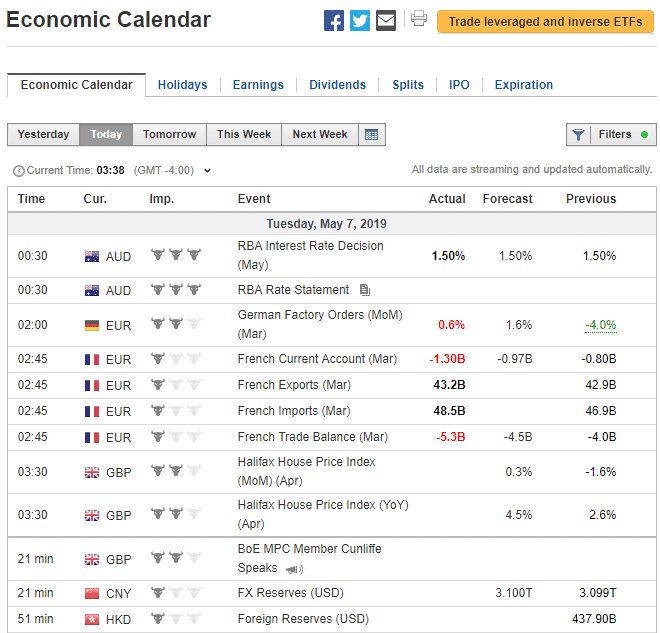
For simplicity, most of them will allow you to filter so that you get information from only your countries of interest. Most calendars will also forecast what is expected by investors before the real data is displayed, which helps in decision-making.
Differences
| Comparison points | Technical analysis | Fundamental analysis |
| Based on definition | It is used to analyze the patterns in a chart so that price movements can be identified. If you observe a double top formation, for example, you can predict a move to the downside. | It entails evaluating a country’s economic health and, by implication, its currency.For example, if there is an upcoming Fed decision, this affects the inflation rate, which affects the currency trend. |
| Time frame | In technical analysis, one often uses a short time frame, for example, a 3-hour or 4-hour chart. | Long term. For example, interest rates have remained unchanged for quite some time. |
| Assumptions | Because price patterns tend to repeat, prior prices can be utilized to forecast future trends. | Examining economic variables is the most effective technique to predict price fluctuations. |
| Target | By analyzing market trends, you can forecast shorter-term price fluctuations. | Other factors can be used to forecast the big picture of a currency. |
| Data | It uses past data. | It uses present data and also past data. |
| Indicators | Uses indicators like RSI, Fibonacci retracement | It uses economic readings like CPI, GDP, PPI. |
| Format | Uses charts | Uses reports |
Word to the wise
In the realm of finance, technical and fundamental analysis may seem like polar opposites. Many investors and traders, on the other hand, have been able to combine the two successfully. Investors that primarily utilize fundamental research might employ technical analysis to find the best moment to buy or sell.
Technical analysis can be used in conjunction with fundamental analysis because it is primarily a market timing technique. The accurate evaluation of the time to enter into an investment can be more crucial than the investment itself at times. As a result, the best advice is to research the fundamental factors, make an investment choice, and then use technical analysis to decide the ideal time to buy or sell.
Investors who primarily employ technical analysis, on the other hand, may benefit from fundamental analysis in some instances. If a technical analyst notices a certain price pattern and determines that a particular stock is a suitable investment, he can further solidify his conclusion by looking at the company’s crucial fundamentals, which can reveal important information about the company’s financial status and ability.
This implies that these two analyses differ from one another, but they are not necessarily mutually exclusive.
Conclusion
Technical and fundamental approaches differ in many ways, from the assumptions they are based on to the methodologies they employ and the roles they serve. The observed differences, on the other hand, do not necessarily imply that each of these analyses leads to different investment decisions. In essence, both analyses offer benefits and drawbacks that can be combined to achieve the best findings.


