Trends play an important part in forex trading. In fact, the most successful traders in the world are those who identify trends early and exit when they are about to end. Knowing when a new trend is about to form or end is a relatively difficult process. In this article, we will identify some of the top strategies used by experienced forex traders to identify the end of a trend.
Japanese candle formations
Traders prefer using candlestick instead of other common charts like bar charts, line charts, area, and point & figure. Candlestick charts are preferred because they show the open, high, low, and closing prices of an asset. Candlesticks were first used in Japan many centuries ago.
As candlesticks evolved, participants in the industry started identifying unique patterns that have evolved to become critical in trading. Some of these candlestick patterns are categorized as a continuation because the asset price maintains the original trend when they form. Others are known as reversal candlesticks since they happen when the price is about to reverse.
Below are the patterns that traders like to use to find trend reversals:
- Bullish and bearish engulfing. When a small bearish candle is followed by a large bullish candlestick that covers its body and wicks, we can see the bullish engulfing pattern. We get a bearish engulfing from a small bullish candle and a big bearish one that opens not lower than the first candle’s closing price and closes below the bullish candle’s open.
- Doji. A Doji is a candlestick that looks like a plus sign. It forms when an asset’s price opens and closes at the same level. In addition to the standard doji, other types of the candle are the gravestone, dragonfly, and long-legged doji.
- Hammer. A hammer is another pattern used to signify the end of a bearish trend. It has a small body and a long tail.
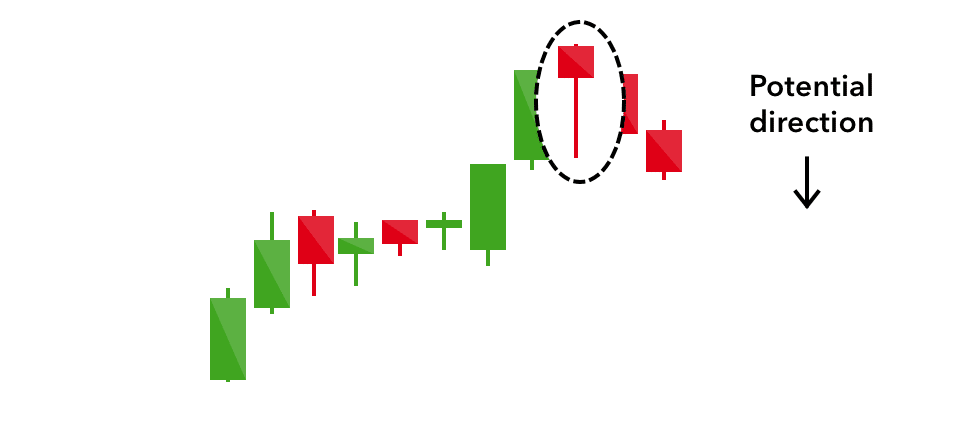
- Hanging man. A hanging man is a candlestick pattern that resembles a hammer. The only difference is that it forms during a bullish trend. It is a sign that a bullish trend is about to end. The chart below shows how a hanging man looks like.
Using chart patterns
Traders also use chart patterns to identify an end of a trend. A chart pattern is different from a candlestick pattern because of how they are structured. Candlestick patterns can be made of just one candle, while chart patterns require several candlesticks.
Chart patterns are usually divided into two: continuation and reversal. Continuation patterns signal that an original trend will continue while a reversal pattern sends a signal that the original trend is about to end.
There are several chart patterns that are used to show this reversal. These are head and shoulders, wedges, and double top or bottom.
The head and shoulders pattern resembles what a person looks like. It forms when a rising asset price hits the first resistance, and it drops, forming the left shoulder. It then rises above the right shoulder and drops again, forming the head. Finally, the price rises to the same level as the left shoulder, and then it drops significantly below the neckline. When a head and shoulders pattern forms, it usually sends a signal that the original trend is about to end.
The rising wedge pattern forms when an asset’s price is rising while forming two upward slanting trendlines. A rising wedge shows that there are bears in the market who are attempting to push the price lower. In most cases, a rising wedge is usually a sign that a bullish trend is about to end. On the other hand, a falling wedge can tell you that a bearish trend is about to end.
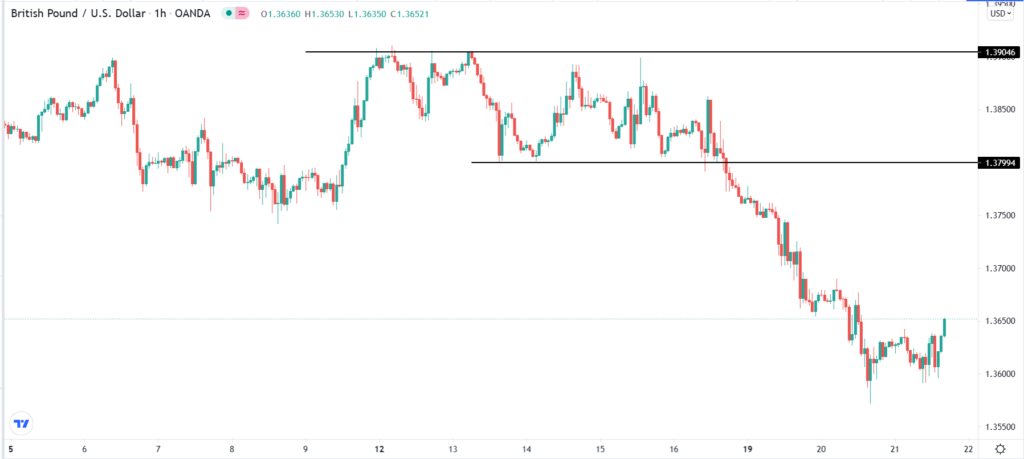
In a double-top, an asset’s price rises and finds the first resistance. It then drops to a certain point and then resumes an upward trend. The price then finds strong resistance at the same level where it rebounded before. In this case, we’ll get a signal of the uptrend’s end if the price moves below the neckline of this double-top pattern. The chart below shows an example of a double-top pattern.
Using technical indicators
Another concept of knowing the end of a trend is to use technical indicators. When used correctly, some indicators can tell you when a new trend is about to form.
Based on my experience as a professional trader, moving average is the best indicator to predict when a trend is ending. There are several ways of using the indicator to do this.
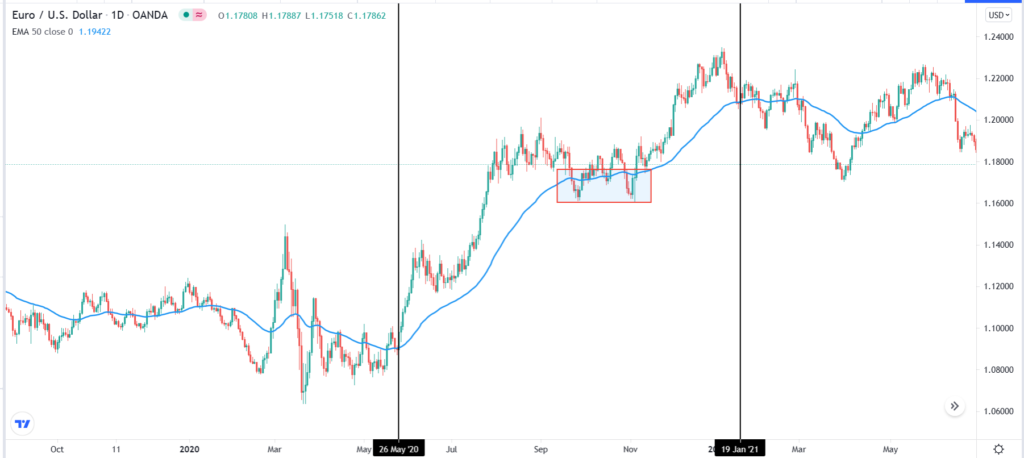
The easiest method is to use a single moving average indicator on a chart. The most effective one, in my view, is the 50-day moving average. In this case, if the price is rising, you can assume that it will remain in a bullish trend as long as it is above the 50-day MA. In case of a bearish trend, the downward trend will remain as long as the price is below the 50-day MA.
A good example of this is in the EUR/USD chart below. As you can see, the price remains in a bullish trend as long as it is above the MA. The potential periods for the trend to end are when it moves and tests the moving average.
Another approach of using the moving average to predict the end of a trend is to combine longer-dated and shorter-dated averages. The trend’s end is determined when the two moving averages make a crossover.
Other indicators you can use to identify the end of a trend are the volume-weighted average price (VWAP) and oscillators like the Relative Strength Index (RSI) and MACD.
Summary
Traders use different strategies to identify the end of a trend. In this article, we have looked at three of the most popular approaches. We looked at how you can use candlestick patterns like the doji and engulfing to identify these situations. We also looked at how you can use chart patterns like triangles and head and shoulders. Finally, we looked at how you can apply technical indicators like moving averages to spot these reversals.


