
Trade with the trend’ is an old trading adage that has proved to be effective in the generation of consistent profits. Trend trading is a popular trading strategy where traders seek to profit from an underlying trend either a downtrend or uptrend. For this reason, technical traders, as well as forex expert advisors, deploy a number of forex trading instruments to identify the long term trend as part of trend trading.
Long-time frames are the best for determining trends for traders focused on positional trading. However, for traders or forex robots engaged in scalping or swing trading, shorter time frames are often used to determine the underlying trend.
So how do we understand a trend? Here are the basics of technical analysis, that help you to identify technical market conditions:
Uptrend
When the asset prices are making higher highs and higher lows, we call it an uptrend. Here the fall of price remains higher than the previous low. This fall is also termed as a correction. An uptrend consists of both up move and down moves. Up moves are bigger and higher than the down moves, which are correcting the prices.
Downtrend
Similarly, when the asset prices are making lower highs and lower lows, we call it a downtrend. Here the rise of price remains lower than the previous high. This rise is also termed as a correction. A downtrend consists of both up move and down moves. Down moves are bigger and lower than the up moves, which are correcting the prices
Side-ways trend
The markets are choppy, and the highs and lows compete and are tested against a new high and a new low, moving in the specific range. Trend following trader believes that “the trend is our friend” and thus tries to avoid this kind of pattern. This phase of an asset is called the “consolidation” phase.
Using moving averages to use a trend in your favor
Technical analysis is the study of analyzing assets’ historical price movements to predict the possible action. Moving averages are some of the best forex indicators for ascertaining trends in the forex market, as they follow the trend of an asset. There exist various types of moving averages like simple moving average, exponential moving average, smoothed moving average, linear weighted moving average. Out of all, exponential moving averages have been more efficient in comparison, and from now on we will only follow exponential moving averages (EMA). In these examples, we are going to use 21 interval period exponential moving averages and 55 simple moving averages to determine an uptrend and a downtrend.
First things first, why 21 and 55? It has been observed that prices move in patterns. The numbers come from the Fibonacci series and are mostly respected by traders across the world.
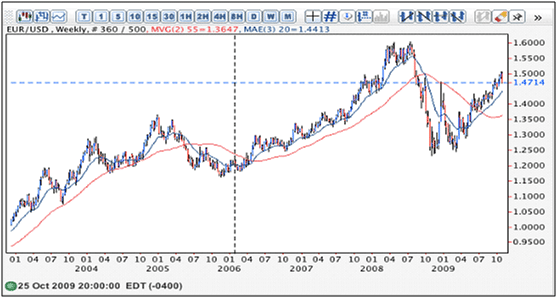
A closer look at the chart above, it is clear that the 20-EMA is above the 55 SMA from 2004 to May 2005, with the moving averages sloping upwards. As long as the 20 EMA is above the 55-SMA, the same is interpreted as an uptrend, and price often tends to trend upwards.
The price continued to trend upwards until August 20O8 when the price reversed downwards. Likewise, the end of the uptrend was confirmed in August 2008 as the 20EMA crossed the 55SMA from above signaling price is now in a downtrend.
MA entry signal
Here when we observe the yellow-colored line is the exponential moving average of 21-interval and the blue-colored line is the exponential moving average of 55-interval.
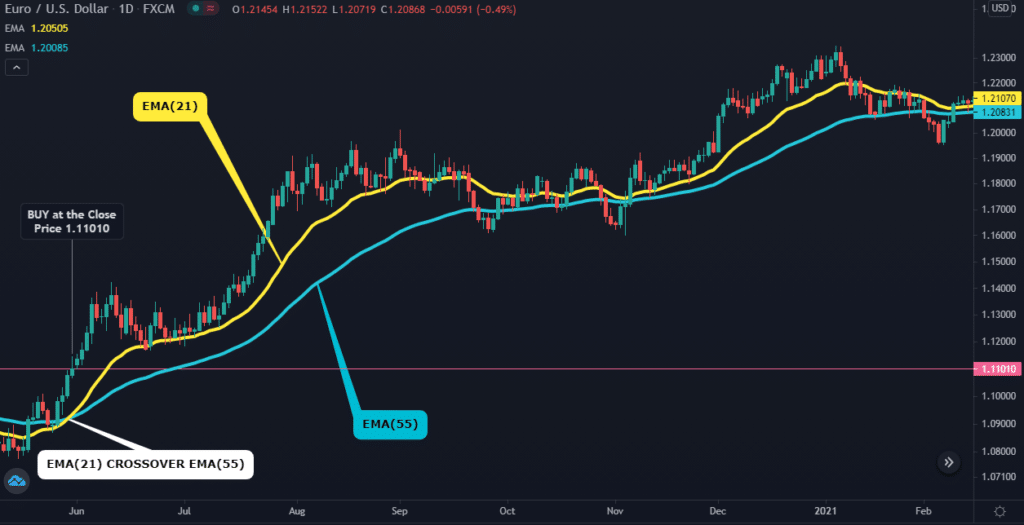
The 21-interval moving average claims the signal and the 55-interval moving average claims the trend. Once we catch a bullish crossover – when EMA (21) > EMA (55), it is a buy signal. This calls a long-term bullish trend for prices and the short-term trend has also potential for the upside. Thus we have entered the trade at 1.11010.
The consolidation phase
Technical analysis is mostly about the strength of price. The moving averages lines flow over time in the desired trend, and so does the price. As we observe that as the price reaches new highs, the averages rise along with it, and then gradually the difference between the lines narrows. This is the phase where the asset prices are mostly correcting and consolidating. During this phase of the cycle, we do not trade, as the markets are choppy, and uncertain about the direction.
Moving average exit phase:
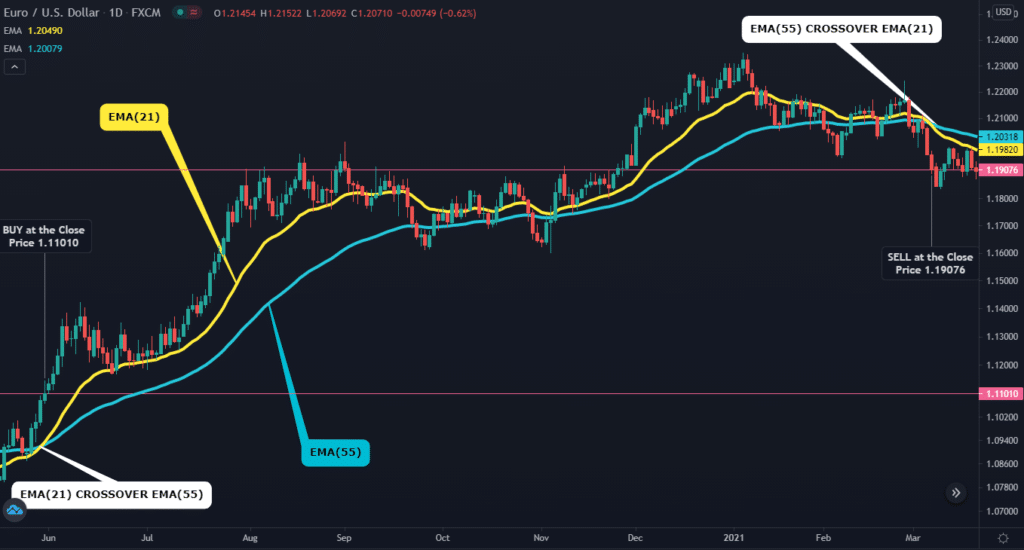
Now after a long consolidation, we observe the bearish crossover, where EMA(55) > EMA(21) and thus the prices are expected to go into a bearish trend, and thus we should square off our positions. The crossover is confirmed with the closing of the candle at 1.19076.
Booking the profits
We finally booked a profit of 806 pips. The rally from 1.11010 to 1.19076. This is a simple strategy and a very passive one. As we wait for signals to activate, then we proceed with the trade, so is the case here.
The concept of moving average is followed across all the assets. As the moving averages follow the footprints of the prices themselves, they ought to perform well. We can perform backtesting on any of the asset classes to observe the importance of moving averages.
Best Forex Trend Trading Strategies
4 Hour Trend Trading Strategy
The 4-hour trend trading strategy exploits the popular saying that the underlying trend is your friend. Likewise, we use 34-period and 55-period MA to determine the underlying trend and the 1-hour chart for determining entry and exit points.
With these strategies, traders or automated FX trading systems can eye buy opportunities when the 34MA is above 55MA and sell opportunities when the 34MA is below the 55MA signaling a downtrend.
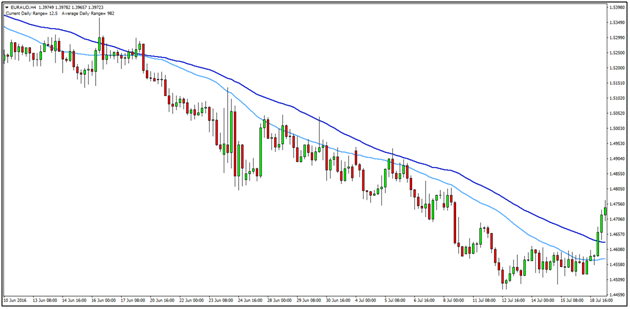
As it can be seen in the 4-hour chart of EUR/AUD, the price is trending downward as the 34MA is below the 55MA. In this case, a trader or other forex trading instruments would enter short positions as soon as price touches the 34 or 55 MA on a correction upwards, resulting in the formation of a big bearish candlestick.
The moving average acts as a resistance level, whereby price bounces off and starts to move downwards. In this case, a trader would enter a sell position as soon as price closes below the moving average on the 1-hour chart.
Enter and Let Run Trend Trading Strategy
The strategy is for the most conservative traders or forex robots that wish to take a limited number of trades. The strategy entails identifying the long term trend and placing a trade in the direction of the trend. The position is left to run in line with the underlying trend.
A trader or an automated FX trading system would close the position only when the trend reverses and starts moving in the opposite direction.
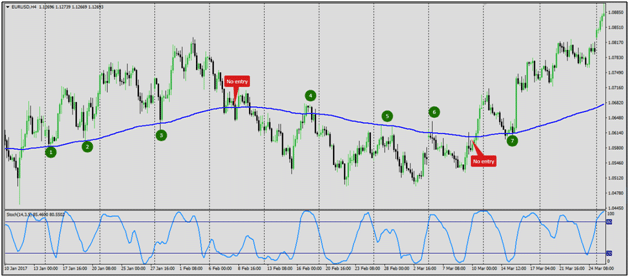
A closer look at the first half of the chart above, it is clear that price is trading upwards above the 200D Moving Average. In this case, traders or forex robots could have entered trades as soon as price touched the 200MA from above and failed to breakthrough. It is clear that a trader who entered long at position 1 stayed long as the price was above the 200MA
A sell position, on the other hand, would have been triggered at position four as price struggled to move upward after a pullback from an initial breakout.
Trend Reversal Trading: Double Tops and Double Bottoms
The forex market is just like the equity markets, but here the underlying asset is not a company but the economy as a whole. Thus, when prices move in patterns often at times, they try to reflect on the past economic performance.
The famous double bottom and the double tops trade are easy to identify, and the following are the ways how we trade onto them.
Double Top
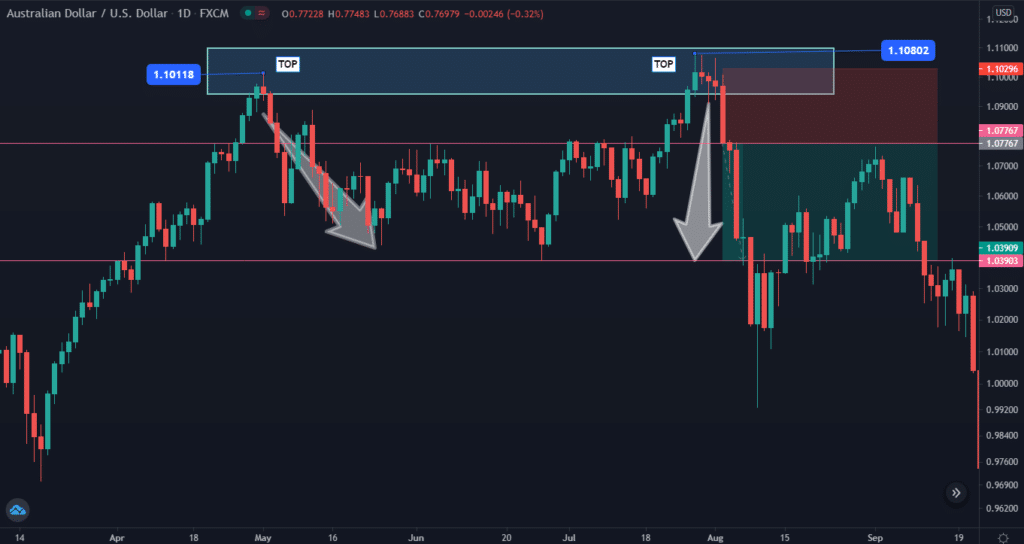
This is AUD/USD daily chart. As we see that previously, the prices have fallen from the 1.10118 levels. That was the highest peak of the swing. Later, we see the prices rejecting again from the 1.10802 levels. The catch here is, there might be differences in prices but the difference must not be too big.
Entry strategy:
After identifying, we need to be sure of the reversal. We wait for the confirmation.
First things first, how to identify a confirmation in reversal? We see the candles at the second top having wicks on the top, this explains fading momentum for the bulls.
Later when the candle closed below the previous green candle, we entered. This is the point of confirmation when a candle with good strength closes below the prior bullish candle. Thus Bears have taken the charge.
Stop loss
Before setting the Take Profit, it is important to set our stop loss. We fix our stop loss at the high +5 pips of the candle, we enter the trade. Such that if bulls are so strong that if they can beat down a strong bear candle, the potential of bulls taking a higher high is possible.
Exit strategy
We trade here with a good risk/return ratio. The take profit levels would be near the swing low.
And thus we observe how easily the target is achieved. At this point, we can book a part of open positions and let the remaining trade for the next swings low. Here, we also trail our stop loss to the cost price i.e the close of the bearish strong candle & let the market perform the best.
How to identify the reversal
Reversals are observed with the help of the candlestick patterns. Usually, a bearish engulfing, an evening star, or a hanging man pattern is looked up to identify rejection from the top. As we sometimes see a pin bar candle on the top, we trade taking a short position on the next candle crossing its low, as discussed above.
We finally booked a profit of 385 pips. The rally from 1.07767 to 1.03903.
Double Bottom
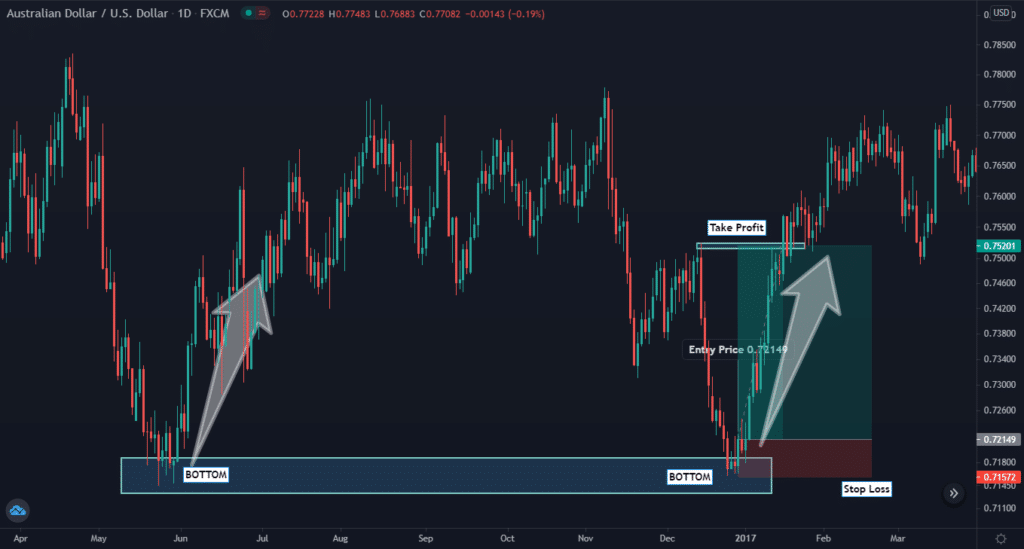
In just this image, the understanding of the double bottoms would be cleared. How we see a rejection from the previous lows & there is a decrease in the bearish momentum, and finally, the bulls take in the charge & there is a 305 pips profit at a go. Thus we have learned how to trade the double bottoms with proper stop loss fixed at the lows -5 pips of the strong bullish candle and the take profit at the previous swing high.
Whenever double tops and double bottoms appear on a trending chart, they signify that the underlying trend is slowing and losing momentum.
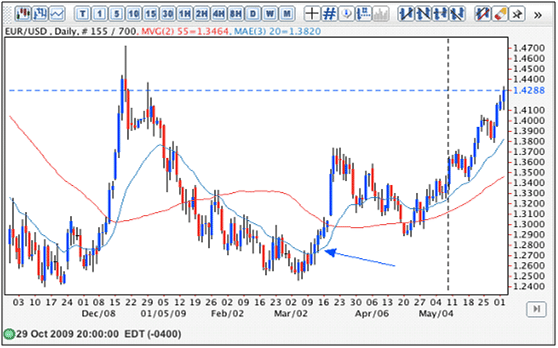
The chart above shows EUR/USD trending lower starting in May 2009. However in March the same year, price formed a double bottom indicating that the downtrend had lost its momentum and that price was about to reverse upward as part of an emerging uptrend.
The Uptrend from the double bottom was confirmed on March 30 as the 20 MA crossed the 55 MA from below, signaling a strong uptrend.
Price Breakout Strategy With Trend Following
Traders prefer trading with trends. Betting against a trend is too risky even for scalpers. Once we identify a trend, with new highs, we understand it is an uptrend. So when does a trend continue? A trend continues when there is a breakout above the previous high. So we trade only with the breakout levels considering a proper stop loss, to manage the capital at risk.
Entry
Here, by looking at the image below, we understand how the trend breaks about the consolidation zone and starts trading bullish. We enter the asset on the “breakout and hold” basis. We enter at the close of the strong bullish candle.
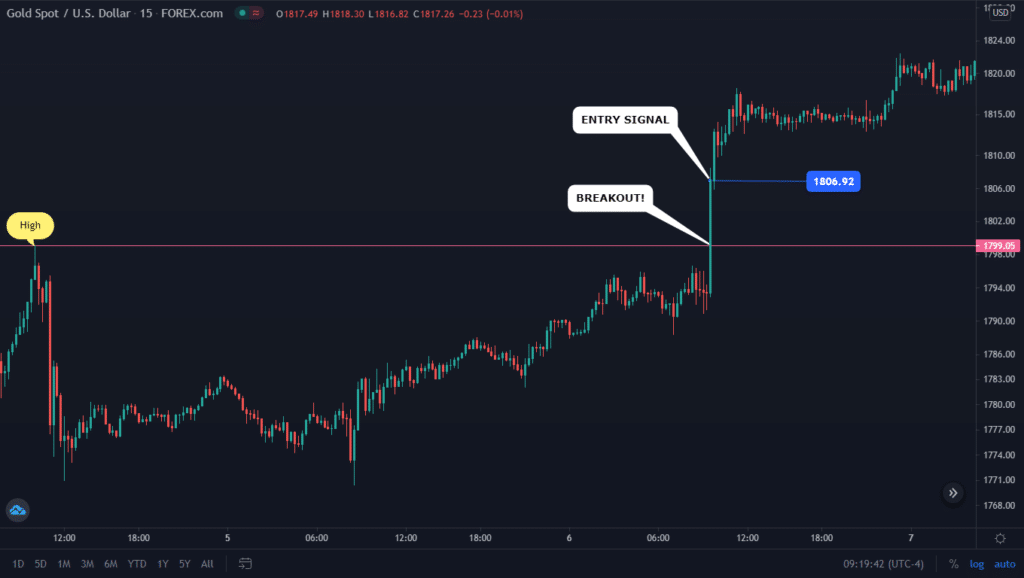
Stops and take profits
Under this strategy, we keep the nearest swing low as our stop loss levels. As we know, if that level is broken, the prices either will fall into a choppy range or a downtrend. Thus the low -5 pips would be our Stop levels.
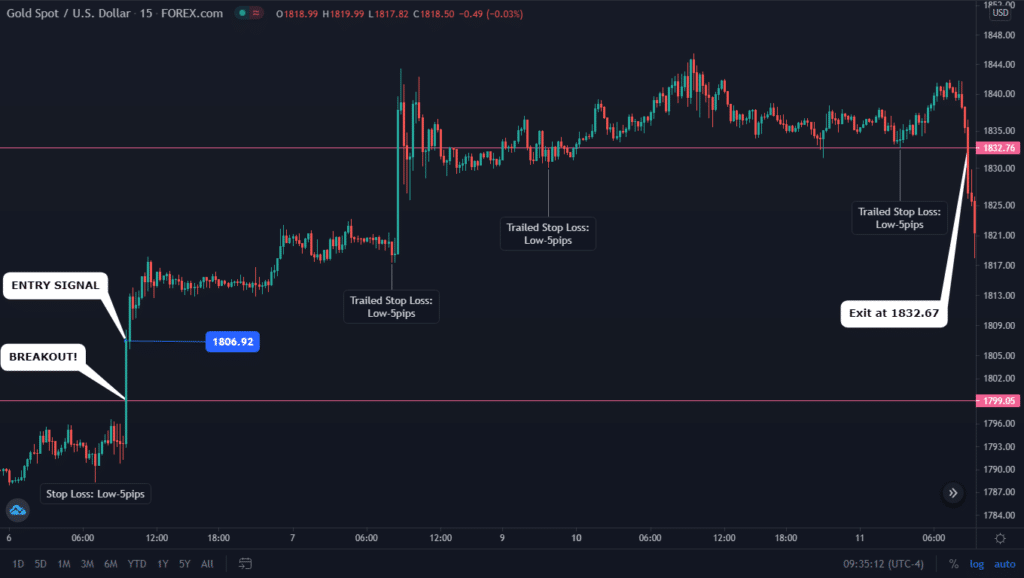
The previous high is expected to be tested. When we enter the trade based on a breakout, we must keep the next high as the take profit level.
Also, we keep trailing our stop loss to the nearest lows – 5 pips, to be sure that the trend is continued.
Note to remember
If the immediate previous high versus previous low isn’t at least 1:1 in ratio for Risk to Reward, then it is not advised to take the trade.
Why the risk-reward concept is so important?
The disciple keeps a trader alive. What is the discipline in the financial markets? The discipline is the system market participant has to follow: the trading setup must have a stop loss level, a take profit level, and a predefined position sizing.
When trading, we must set our capability to bear the loss. In general, it should not be more than 1% of the capital, per trade. This is called the risk per trade. Now when we set our take profit, it is advised to keep it at least 3 times the risk (stop levels). The 1 to 3 risk to reward ratio goes fine for positional and swing trading. Whereas, while trading intraday, or for scalping, we have to enhance our risking ability. In any case, this should not go beyond 1:1. Risk appetite should be at least as equal as the reward expected.
Conclusion
Moving averages are some of the best forex indicators for identifying underlying trends as part of trend trading. For positional traders looking to hold positions for week’s months or even years, the indicators should be used on longer time frames to identify long term trends.
Once a trend has been identified a trader or a forex robot can open a position in the direction of the trend and let it run as long as the price above poor below the underlying long term moving average. The idea with trend trading is to stick with the trend until a reversal occurs.
While concluding we must understand that trading in the forex market is very risky. Risk of permanent loss of capital. On the other hand, it should not be discouraged as it has a huge potential of earning. A fine knowledge of trading, accompanied with the discipline required, often leads to colorful results. Overdosing with leverage, moving a high portion of capital in one trade, or even trading on somebody’s tips might be risky. But with proper knowledge of technical analysis, and understanding of charts might lead to wealth creation.
Last Updated: May 17, 2021


