
A trend in the financial market is an asset’s tendency to move on a particular side for a respected period. It is also known as market structure and is one of the most favorite price action patterns by many traders. ‘Trend is your friend’ is heard throughout the inception of the industry, which is applicable on all assets, including forex, stock, futures, metals, commodities, etc. However, some opt to get in on the potential reversals and make their strategy accordingly.
Types of trend
There are three types of significant trends in the markets:
- Uptrend. An uptrend is classified by a price action that gives higher highs and higher lows in the chart. Such a trend is prevalent in bull markets, where there are more buyers than sellers. As the asset moves upwards, the bears try to keep it down, which results in a higher low. In the end, nonetheless, the bulls are always the winners.
- Sideways. A sideways trend is also known as consolidation or resting period for the market. It is an area under support and resistance where the price continuously bounces back and forth. The asset is taking a breath before it continues on its original trend or reverses back.
- Downtrend. When the price is continually making lower highs and lower lows, this market structure is a downtrend. It shows that the bears have taken over the asset, which continues to fall under the pressure. Buyers or bulls try to push the market in their favor, which results in minor pullbacks.
The trend in technical terms
Now that we know what a trend is and its types, we can discuss its technical nature. An asset’s value is always under the influence of buyers and sellers, aka bulls and bears. These are responsible for driving the price up or down, as we discussed before. Technical traders thrive on the opportunities given by the market during its movement. Trend lines are drawn explicitly on the charts to determine which phase the market is in.
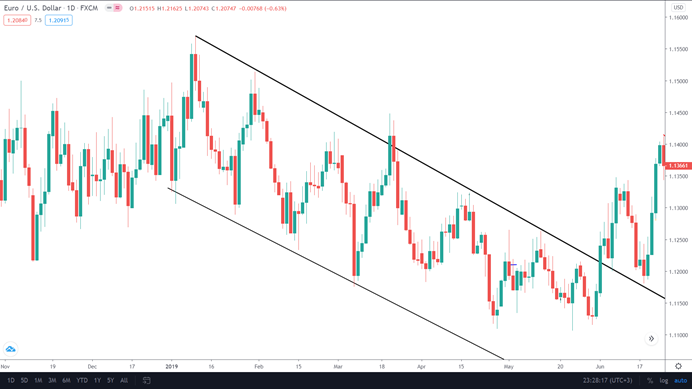
Image 1: Two trend lines have been drawn to give what is called a channel. As you can see, the market is in a beautiful downtrend on the daily time frame with lower highs and lower lows.
The other famous tool is Fibonacci retracement that is available to measure the retracement in market structure. The pullbacks that occur due to profit-taking when the price reaches a specific high or low are valuable opportunities for many traders to get in with the overall trend.
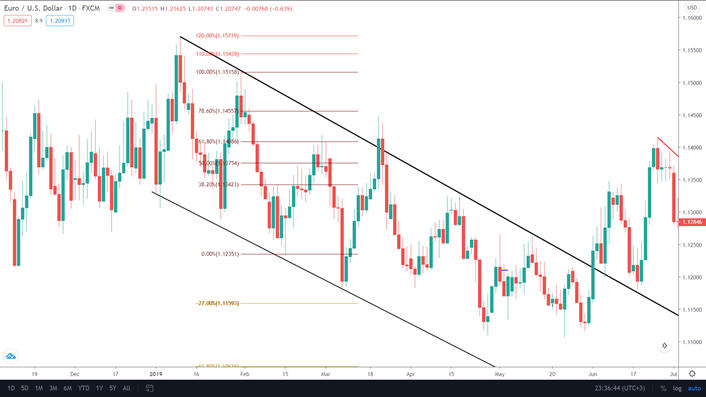
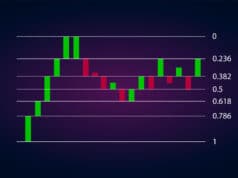
Image 2: Fibonacci retracements play a vital role in measuring the pullbacks during an up or downtrend. On this chart, they are drawn using the previous lower high to the next lower low. 38.2% and 61.8% are the most famous retracement levels.
What is trend breaking?
If the price crosses the previous higher low by a considerable margin in an uptrend, the trend or market structure is broken. In this case, we also say that a trend is reversing. The asset continues down under the influence of sellers making lower highs and lower lows in this case.
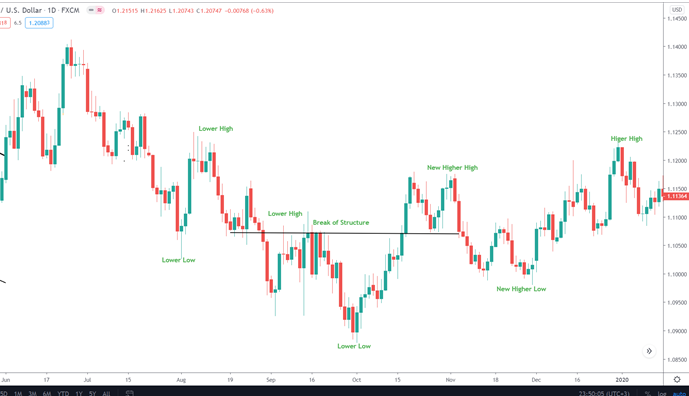
Image 3: You can see the downtrend broke as the market crosses the previous lower high. The price has shifted towards an uptrend and will continue to create higher highs and higher lows.
Identifying trend in different time frames
A trend that may seem to you in favor of buyers at a particular time frame may actually be on the sellers’ side on a larger scale. This can lead to big-time losers and frustrate you in your trading.
The retracement on a higher interval will appear to be a downtrend on the lower interval. The fact that we can see more bars in a low-value period explains this easily. Let us take a look at an example where such a case is prevalent.
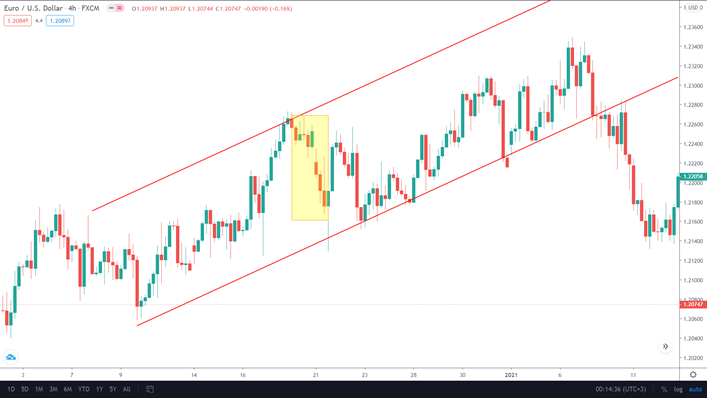
Image 4: An uptrend on the 4-hour chart. Note the yellow highlighted area that is a pullback on this chart.
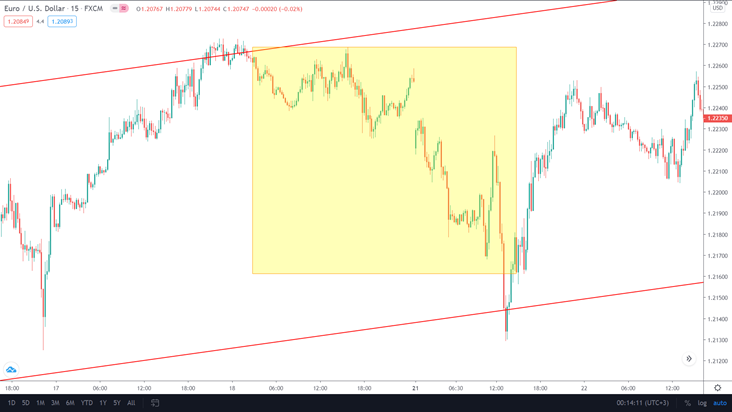
Image 5: The same yellow part shows the lower time frame, such as M15, where the price is actually in a downtrend.
Some traders will dive down into lower time frames to better analyze the charts and get a good entry on the more dominant uptrend.
Benefits of trading with the trend
Humans as a species have stood together to survive as a species. It is always advantageous to stay with the herd. Trend trading is no different and offers the following benefits for a trader:
- The win/loss ratio can get a considerable increase in favor of the trader. For most technical traders who lose consistently, staying with the market structure is recommended. It has a significant positive impact on their trading.
- The risk-reward ratio is more favorable. Also, the entry and exit points of execution are readily available with the help of Fibonacci retracements.
- You don’t need to get in on trade at an exact point. Traders can use the pullbacks as opportunities to open their positions. Remember that small fluctuations or retracements are seen as safe havens and not to be worried about.
- Trend trading does not require much time from your side. The market takes its fair share doing its thing before it presents a chance for you. Even those with a full-time job can follow market structure easily.
- Mixing up the market structure or trend with other forms of trading strategies is effortless. Technical traders combine it with Fibonacci retracements, trend lines, support and resistance, key levels, and supply and demand zones to get the best out of their executions.


