
There are various Forex indicators that calculate things like the direction of the trend, overbought levels, momentum, etc. But, the ATR indicator is an exception because it uses none of these while letting you establish a short term target so you can use 50% of your position to take the gains and use the rest for earning more money in the future. It is particularly helpful for daily traders as they can find out excellent points for entering trades and placing stop orders using ATR.
What is the ATR indicator?
The ATR is an indicator consisting of a single line that depicts how volatile a currency pair is. Unlike the MACD indicator, it does not deal with the direction or trend of the price instead of showing the level of volatility over time. In the Forex market, during consolidation periods, you will see the value of the ATR decreasing, and similar behavior is shown by other financial assets as well.
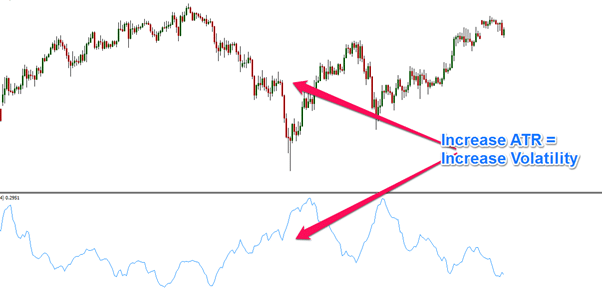
The ATR indicator line swings within a certain limit, and when the value is high, it is an indication of high volatility. Conversely, when the value of ATR is low, it implies low volatility levels. In spite of the fact that many merchants prefer indicators that calculate momentum, it is a great tool for determining volatility levels and predicting price breakouts.
Seasoned Forex players know that it doesn’t take too long for a highly volatile market to shift to a low volatility period and vice versa. For traders dealing with the surge, this is a priceless trading oscillator that brings in substantial profits.
Reading ATR
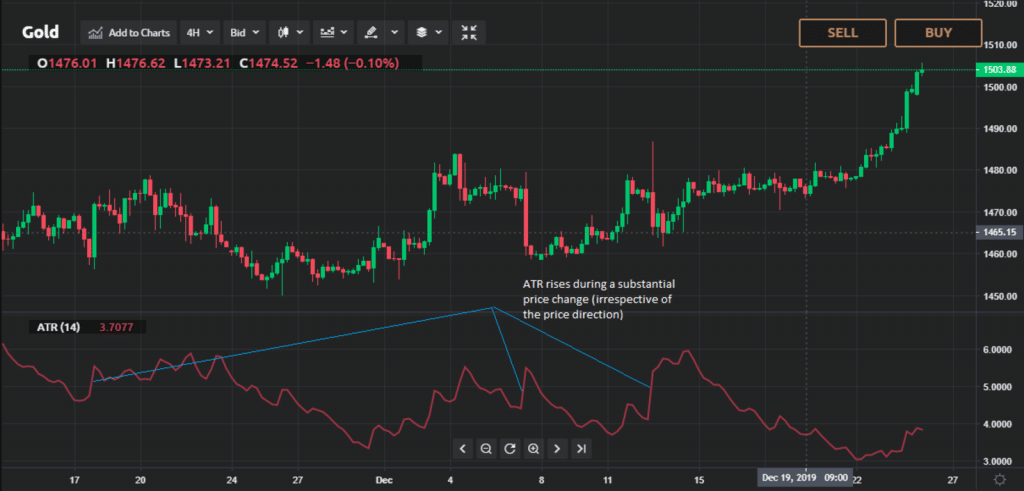
From the above image, you can see that no matter the direction, the value of ATR rises whenever the price change is substantial. There are no complicated procedures to follow while reading the ATR from a chart. When the value of ATR is high, it indicates that the volatility is high and vice versa.
It should be noted that this oscillator does not tell you anything about the direction in which the trend is progressing, and you only get to see how the volatility changes.
Calculating ATR
In order to compute the ATR, the TR for every given period needs to be estimated. Then, you should calculate their mean with the help of a formula. At first, you need to evaluate the below:
- High of the Latest Period – Low of the Latest Period
- Latest Period High Absolute Value – Close of Preceding Period
- Latest Period Low Absolute Value – Close of Preceding Period
After that, you need to find out which one has the greatest value among the three. You need to use the first formula when the latest high exceeds the previous one, and the latest low is lower than that of the previous period. The remaining two are considered when there is a price gap or the preceding period inundates the latest one.
The real True Range is the highest value generated by the scenarios given above. The EMA (Exponential Moving Average) should be used for calculating the average true range. Today, there are several trading software using this indicator, and they will compute this value on their own, so hardly anyone does manual calculations.
Nevertheless, in order to utilize the indicator to its maximum capacity, you should understand how it works. Most platforms use 14 periods as default for ATR but allow for manual adjustments as well. After calculating the mean true range for these periods, we can determine future values using this formula:
ATR = [(Previous ATR x 13) + TR] / 14
Forex trading decisions using ATR
While the ATR gives an accurate indication of volatility in the Forex market, this is not the only thing you should depend on. It is important to combine it with other tools like price action analysis and other oscillators to determine the momentum or the price trend.
Traders often use the ATR for finding prospective breakouts and setting stop-losses so that their positions are not terminated before time. Suppose the price of a pair shifts by $0.5 per day on an average, but in spite of no major financial news being released, the price increases by $0.75. Now the price has shifted a significant distance from the mean, and the stratagem tells you to buy the pair.
This signal might be genuine, but given the fact that the value has shifted far from the average, it is imprudent to bet on a further price rise. In this scenario, it is more probable that the value will sink and roam within the fixed range. While it is not the best decision to buy a currency when its price lies close to the daily maximum, initiating a sell signal is a wise decision, provided there is a valid signal.
Using ATR for determining exits
The ATR indicator can also be used for defining good exit points in Forex trading. Based on the way the market behaves, you can set your profit limits and stop losses. Normally, when the ATR value is high, the range between the limit and the stop should be wide since the price movements are going to be unpredictable when the market volatility is high.
When the range is much narrower than usual, you stand the risk of exiting your positions prematurely, thus suffering a loss. Likewise, you may miss out on some of the profits if the position is closed before time due to the limit being set too low.
In conclusion
Now you know how the ATR indicator functions, and you can conduct forex trades according to the information provided by it. That being said, some indicators are more suitable for some individuals, depending on their trading strategy. You ought to put this oscillator in practice with the help of a demo account before engaging in live forex trading.


