The Fibonacci number series was created by the 12th-century Italian mathematician Leonardo Bonacci. The ratios between these numbers can be found scattered throughout the world in various fields, and for many years, Forex traders have used them to point out key price reversal occasions. Here, we will talk about what these strategies are and how to use them, followed by four different strategies that can bring you huge profits.
What is a Fibonacci trading strategy?
In the foreign exchange market, the price trends of currency pairs can be tracked via used strategies based on the series. In the event of a pair trending in a unidirectional fashion, a few traders forecast a fall in value or a price pullback. As per individuals using Fibonacci for placing trades, the price turnaround points occur when the retracement levels are 23.6%, 38.2%, or 61.8%.
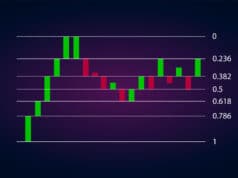
These retracement levels are charted using the peaks and troughs, and the key ratios are marked accordingly, producing a grid. In this grid, there also lies the retracement level of 50%, in spite of the fact that it is not in accordance with the Fibonacci series. But, many financial experts consider this level to be extremely vital, as far as price reversal is concerned.
How to use Fibonacci levels
The Fibonacci level quantifies the percentage turnaround in the price of a pair between two distinct points. Thus, when there is a bullish trend, Forex traders can use them to estimate the surrendered amount from the previous resurgence while forecasting it to rise higher in the future. At first, a couple of anchor points are placed on the previous high and low swings, using the ensuing Fibonacci levels for reference as the price starts retracing.
While working with Fibonacci levels, you should consider the wicks’ fixed highs and lows as opposed to the body. It is irrelevant whether a Forex trader trusts the Fibonacci series to highlight the price reversal point or not because the market is dynamic, so by assessing the girth of every reversal, you can tell exactly where there are highest probabilities of different types of pullbacks occurring.
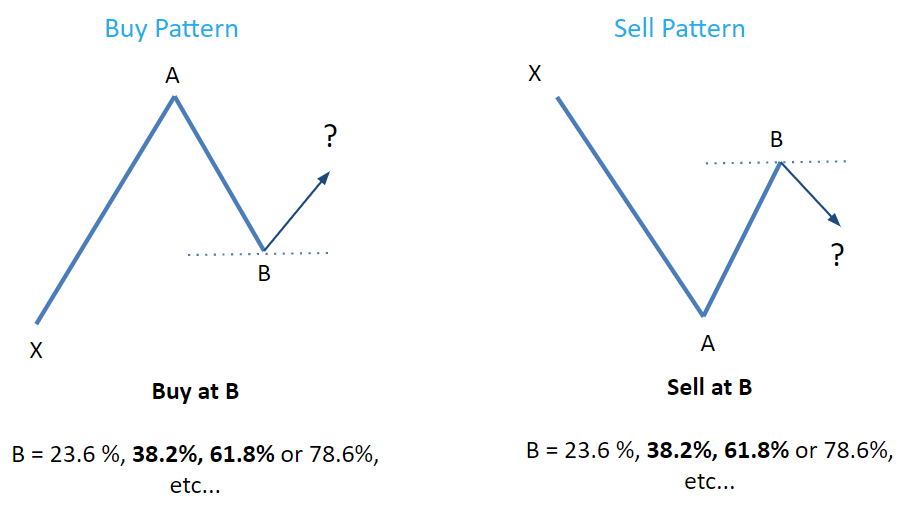
Consider the two patterns shown above. The one to the left is used for a bullish market where Forex traders will try to gauge the distance retraced by the price while moving from point X to point A before reaching point B and rising upwards again. The support level that causes the price to rebound could be represented by Fibonacci ratios.
The pattern to the right is for a bearish market where people try to calculate the distance retraced by the price while moving from X to A. After this, it reaches a resistance level and moves downwards, with B being a retracement level.
Best trading strategies
We have collected four strategies here that enjoy the greatest popularity among traders most, and you are welcome to have a closer look at each of them below.
Trendline
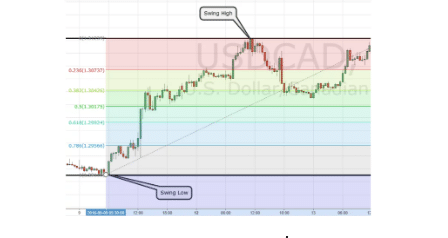
Take a glance at the Fibonacci retracement chart above, with the swing high and swing low denoted properly. When there is a bullish trend, you are better off starting with the latter and drawing the levels up in order to reach the former. When the market is bearish, you’d want to begin from the swing high point and pull the levels down until you reach the swing low.
Next, you need to draw the trend line and wait patiently for the price to hit it, longer for a while and then go back to following the trend direction. In case the price crosses the trend line and keeps exceeding the ratios, it is a sign that the trend is done for, and you should start looking for other options.
If the price has hit the trend line between 38.2 and 61.8, you can consider it a good sign as these are reliable retracement lines. You can make a buy entry when the price closes above 38.2%/50%. A sell entry can be made when the price closes below 38.2%/50%.
Pullback trades
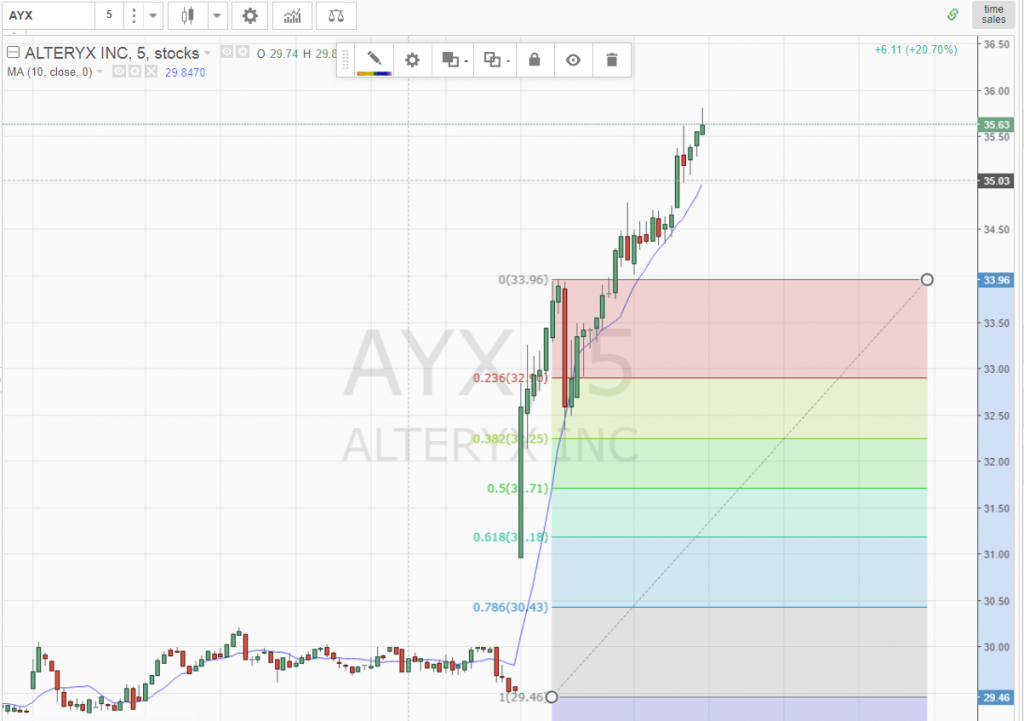
In the beginning, you need to find a price that is trending strongly. Day traders should use 5-minute charts for this purpose, about half an hour after the opening of the market. After you recognize an intense bearish trend, you ought to monitor the price movement around the retracement levels of 38.2% and 50%.
You should make an entry when the price starts to slow down or gives an indication of a reversal. As a profit target, you can use a Fibonacci level or the latest high. The chart above clarifies this point, and you can see how the price remains on top of the retracement level of 38.2% and makes a higher peak later on.
Using this strategy, you can enjoy a success rate of 40-70%, provided you can check your emotions and strictly follow the guidelines.
Breakout trades
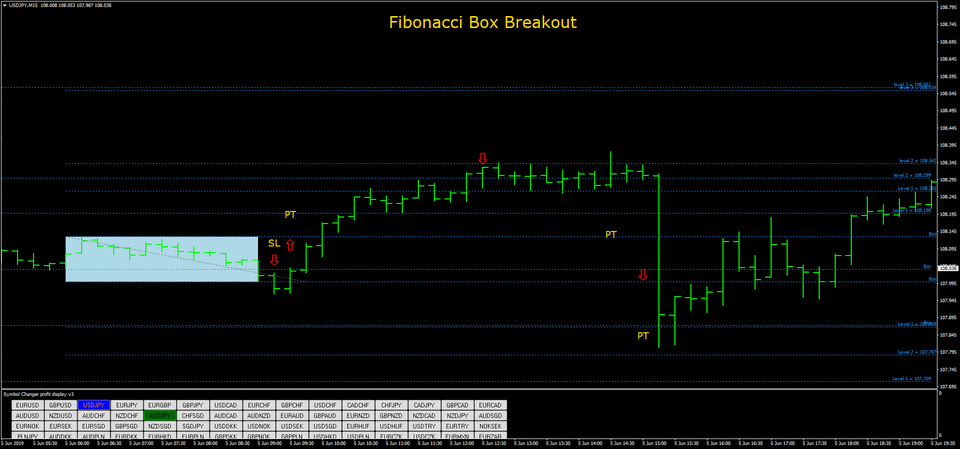
As per the breakout strategy rules, a buy order that’s pending should be placed two pips above the box’s top edge. The stop loss can be placed either at the box’s lower level or as per the currency pair. For instance, it could be 15 pips for the EUR/USD pair.
A sell order should be placed two pips beneath the box’s lower edge. The stop loss can be situated at the top level of the box or depending on the currency pair.
Fibonacci + MACD
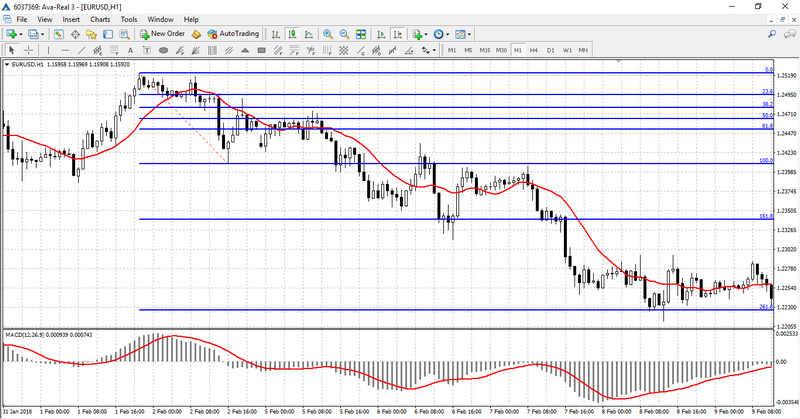
The above chart shows Fibonacci levels being used alongside a 10-period MA. In order to place a sell order, the line must cross the MA upwards, and the MACD histogram must cross the line upwards as well. If the level reverses in the right direction simultaneously while the price exceeds the MA, you should open a sell order.
Summing up
Therefore, you gained some insight regarding the 4 Fibonacci strategies that you can use for trading in currencies. There is no one stratagem that’s suitable for all, so you need to experiment a little before you find out which one is best suited for you.


