
Chart Indicators are used by traders to improve the overall trading experience and enhance their profits. Indicators like the Bollinger Bands, Keltner Channels, and the MACD were discussed in the previous article – let’s find out about other popular chart indicators below.
Parabolic SAR
Created by J. Welles Wilder Jr., the parabolic SAR (Stop and Reverse) is a trading indicator that uses the direction of the trend to develop forecasts and is effective at analyzing trend reversals. A trend reversal refers to a turn in the direction of a trend. Traders can use the PSAR to set a stop-loss for the specific price action. A Parabolic SAR is denoted by dots that are present above or below the price line on a price chart. The location of the dots represents the direction of the trend – dots above the trend line denote a downtrend while dots below the trend line denote an uptrend.
The PSAR helps traders in assessing short and long positions. For instance, you should:
- Take a long position when there is a green arrow under the trend. A red arrow below the price line denotes the closing of a long position.
- Take a short position when there is a red arrow above the trend.
- Close a short position at a green arrow above the trend line.
To trade the dots in the PSAR, go for selling when the price goes below a single dot. The occurrence of an upper parabola break can be used for buying action. PSAR is a useful tool for short-term market analysis. The use of PSAR doesn’t give optimal results in the long run, as multiple variables affect the long-term behavior of a trend.
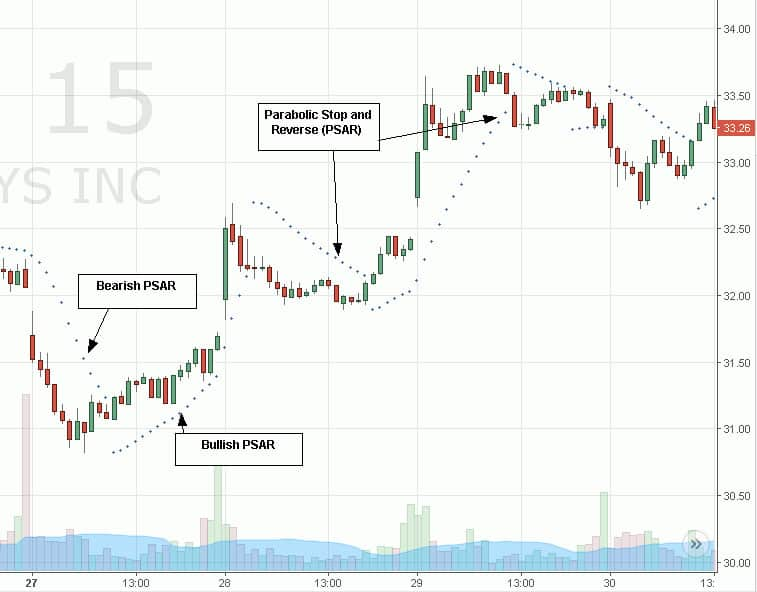
The graph above represents a typical PSAR where dots are placed above and below the candlesticks. The bullish PSAR is represented using dots below the candlesticks, and the bearish PSAR is denoted using trends above the candlesticks.
Average Directional Movement Index (ADX)
The average directional movement index is an indicator that shows the strength of a particular trend. It is denoted by two sub-indicators: The Positive Directional Indicator and the Negative Directional Indicator. The ADX shows upward and downward movements to represent changes in the trend line:
- A price increase is represented by the positive directional indicator moving above the negative directional indicator.
- A price decrease is represented by the negative directional indicator moving above the positive directional indicator.
The default time setting in the ADX is based on a 14-period moving average. The values of ADX range from 0 to 100, where 0 represents low prices and 100 represents high prices. The ADX does not give much information about the nature and direction of the trend but simply about its movement.
From 0 to 100, the following values are taken to judge the strength of a trend:
- 0-25 = Weakest Trend
- 25-50 = Strong Trend
- 50-75 = Stronger Trend
- 75-100 = Strongest Trend
A weak trend is a sign for traders to hold back and wait for the weak trend to pass. At the arrival of a strong trend, traders can enter the markets openly. This indicator is crucial to safe trading. A strong trend is safer for investors as it minimizes the uncertainties – this is the point where profitable traders maximize their earnings.
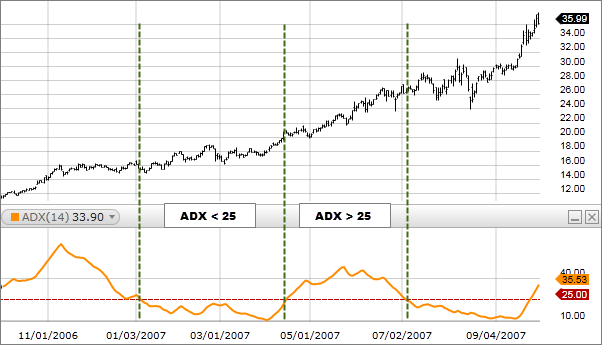
Here is a typical ADX indicator placed below a trend. The indicator registers values below and above 25 to determine trend strength.
Relative Strength Index (RSI):
Created by J. Wilder, the relative strength index is a trading indicator used to identify unusual trend behaviors for an asset’s price. The RSI is a great tool to spot trend reversals and check the strength of various trends.
Given below are some characteristics of the RSI:
- The RSI is a momentum oscillator. It is a tool that analyzes and records price fluctuations for an asset. It moves between extreme values of high and low to capture any price changes.
- The RSI is a lead indicator that forecasts future price movements based on current or past prices.
The RSI lets traders check for overbought or oversold assets. Traders can determine the nature of trend reversals using these signals. The Relative Strength Index is calculated within a range of 0 to 100. There is an oscillating line shifting between the upper and lower limit of the index.
The formula to calculate the relative strength index is as follows:
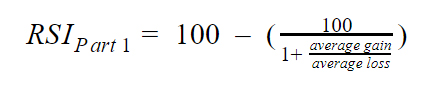
By default, the RSI is calculated for a 14-period average. Traders can customize the time period for their trading objectives.
Follow the steps given below to calculate the RSI:
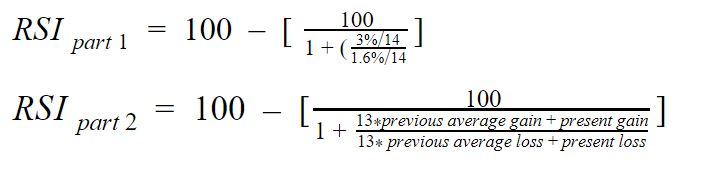
- Calculate how the price fluctuates for the period. Note down the gains and losses for the entire period. Assuming that you measure the values for a 14-period and incur gains for 7 periods and losses for 7 periods, imagine that the values of average gain and average loss are 3% and 1.6%, respectively.
- Now, input the values in the formula of the RSI:
Here, the RSI is formed below a regular price chart for an asset. Two lines are set to denote the high and low bar for the RSI. When the prices move above the RSI lines, it registers them as overbought or oversold.
The RSI registers a value of 70 or more to signal overbought assets, and a value of 30 or less is a signal for oversold assets. Traders need to customize the levels of overbought or oversold assets in case of longer trends.
A midline cross is a major benchmark for the RSI. When the midline crosses above or below 50, it marks the start of a trend. The index goes above 50 for an uptrend and below 50 for a downtrend. It is advised to use RSI with moving averages to confirm trends. For developing support and resistance levels, it is convenient to use the midline crossing strategy.
RSI is a good indicator of market divergences. A bearish divergence occurs when the price rises with the index falling simultaneously. A bullish divergence occurs when the price falls with the index rising simultaneously.
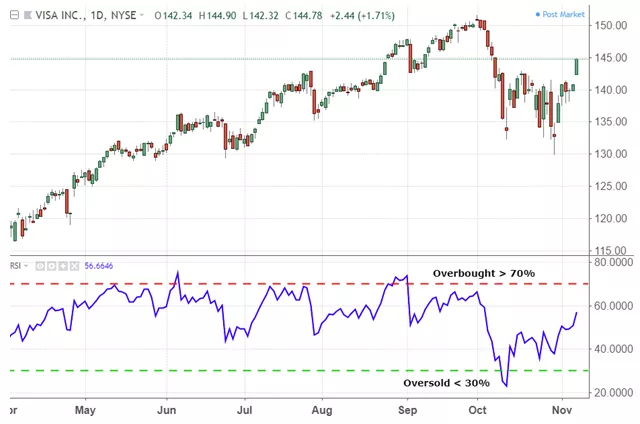
The RSI below a candlesticks chart is showing overbought and oversold prices for an asset.
Final thoughts
Make sure not to rely on just one trend indicator when making important trading decisions. Unfortunately, indicators may often lead to false signals – they are most effective when used with other fundamental indicators of technical analysis. Indicators are present to only aid the decision-making process – traders are advised to assess the risk factors thoroughly and apply their own intellect and experience before making any decisions.


