
When you first start FX trading, you’ll be confronted with several various trend-analysis methodologies. Using indicators is one of them. Most indicators were invented by people who have worked in the field for a long period. One of the most well-known contributors in the currency and financial trading industries is Alexander Elder. He is a best-selling author, inventor, and trader who has published multiple forex books. Elder presented to the world the Force Index (FRC), also known as the Elder Index (EI), in one of his masterpieces, Trading for a Living.
What is the FRC index?
The FRC index is a price and volume-based indicator that is used to gauge the strength of a move or identify potential turning points. According to Elder, a currency’s price movement has three important components: direction, extent, and volume. As the balance of power varies, the FRC index combines all three as an oscillator that fluctuates in positive and negative territory.
Formula
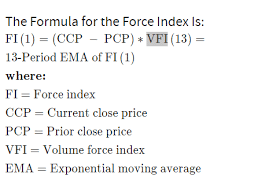
The FRC index has three components.
- Price change, which may either be positive or negative. A positive price change indicates that buyers outnumbered sellers, whereas a negative price change indicates that sellers outnumbered buyers.
- Price change’s magnitude, which is just the current close minus the previous close. The “extent” indicates how much prices have shifted. A large gain indicates significant purchasing pressure, whereas a large loss indicates strong selling pressure.
- Volume, which measures dedication. What is the level of commitment among buyers and sellers? Buyers’ strong commitment is demonstrated by a large advance on high volume. Similarly, a significant drop in high volume indicates a strong commitment from sellers.
How is this indicator used?
1. Pointing out price trends
The indicator essentially indicates a significant change in purchasing and selling momentum. When this index clings to the zero line, traders prefer to stay on the sidelines since it suggests poor momentum. It indicates an uptrend when the FRC index remains above the zero line. It indicates significant purchasing demand when it pushes over the zero line. Similarly, if the FRC index remains below zero, it indicates a downward tendency. The signal of heavy selling pressure appears when the tool dips below the zero line.
Chartists can use higher or lower values for more or less smoothing, respectively, than the default FRC Index parameter of 13.
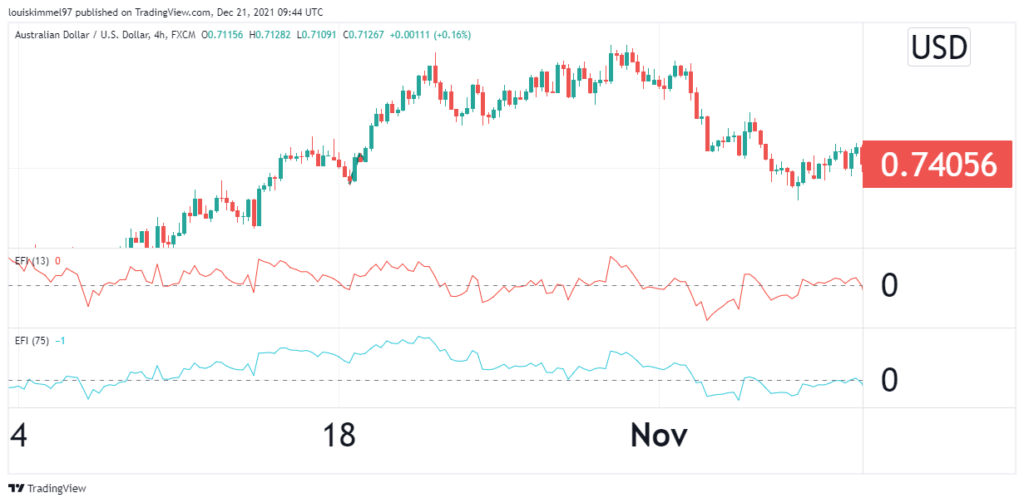
The chart above displays the 75-day and 13-day Force Indexes for AUDUSD. The 13-day Force Index is noticeably more erratic and jagged, but the 75-day Force Index is smoother and crosses the zero line less frequently.
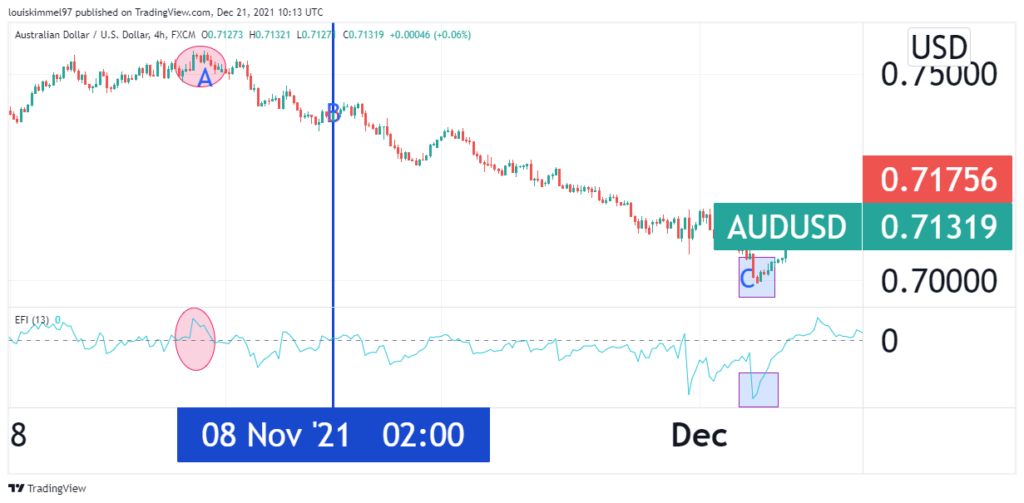
In the chart above, the part marked A is above the 0 mark in the FCR, suggesting an uptrend, which, shows that there is substantial purchase desire. The line marked B is where the FCR is at 0. It indicates poor momentum. The part marked C shows a downtrend. This suggests that there is a lot of selling pressure.
2. Identifying divergence
Bullish and bearish divergences might signal a prospective trend shift to traders. Divergences are a type of signal that is commonly connected with oscillators. When the indicator rises while the security falls, this is known as a bullish divergence. The signal is not confirming price decline, which might indicate a positive trend reversal. When the indicator swings down while the security rises up, this is known as a bearish divergence. Despite the fact that the security is rising, the indicator is falling, indicating underlying vulnerability. This disparity might indicate a bearish trend reversal.
Bullish and bearish divergences require confirmation to be valid. Despite the fact that divergences indicate something is wrong, proof from the indicator or price chart is required. The FRC Index moving into positive territory or a price chart resistance breakout confirms a bullish divergence. The FRC Index sliding into negative territory or a price chart support break might both indicate a bearish divergence. For confirmation, chartists can use other indicators like Moving Average crossings or chart patterns.
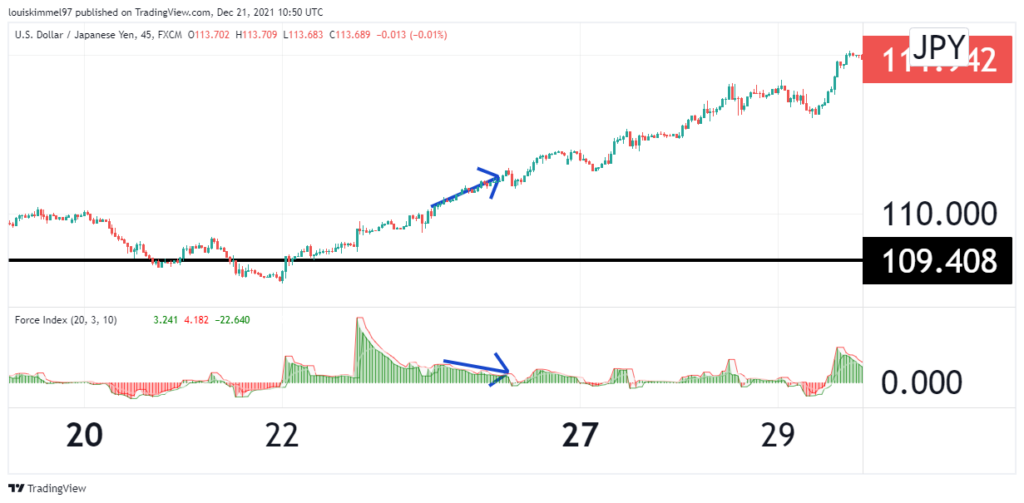
In the 45-minute chart above, the indicator is going down while the pair is going up, indicating a bearish divergence.
3. Identifying correlations
During the trend phase, one can locate suitable entry points using trend confirmation or identification and a short-term Force Index (say, 2-period). It is a rather active technique, but if you want to reduce the number of trade signals, you may lengthen the time period.
A buy signal is created during an uptrend when the 2-period FRC index dips below the zero line and then rallies back above zero. Similarly, a sell signal is issued during a downtrend when the 2-period FRC index goes above the zero line and subsequently dips down below zero.
Advantages
- The indicator is highly useful because it literally confirms the validity of a movement; for example, if a breakout is followed by a spike in the same direction, it helps to confirm the breakout.
- Because volume is smaller and price changes are not as violent as during breakouts, lower force index values are generally linked with sideways market activity. As a result, the value of the force index readings rises during uptrends and falls during downtrends.
Disadvantages
- Breakouts with little volume (lower readings) have a higher likelihood of becoming fake breakouts.
- FRC index calculates the measurements using earlier pricing and volume data due to its design. As a result, they may take a long time to generate signals. For example, the indicator may confirm the breakout a few sessions after the price has broken out. As a result, you may find yourself waiting for confirmation after the market movement has already moved dramatically in one way.
Conclusion
The FRC index will measure the strength of both bears and bulls in a trending market. This indicator is based on the three key determinants of price movement, namely price change, magnitude, and trade volumes. It is used to highlight correlations, identify divergence, and for trend confirmation.


