Different types of traders have devised various FX trading approaches to assist you in making money in the market. On the other hand, individual traders must identify the best Forex trading strategy that fits their trading style and risk tolerance. One of the most popular trading strategies is day trading. Because it’s challenging to find a self-sufficient trading tool, there are a variety of indicators that can be employed during day trading.
What is day trading?
Day trading refers to the process of trading currencies within 24 hours. Although day trading can be applied in any market, it is most commonly used in Forex. This trading style suggests that you open and close all trades on the same day.
If you want to mitigate the risk, positions shouldn’t be open overnight. Unlike scalpers, who are only interested in staying in markets for a few minutes, day traders monitor and manage their open trades throughout the day. Day traders typically use 30-minute, 1-hour time periods or more to find trading ideas. Day traders usually set a daily risk limit in addition to the limit on each position to safeguard their account and capital.
Ichimoku Cloud
First, we will use the diagrams below to see how the indicator looks.
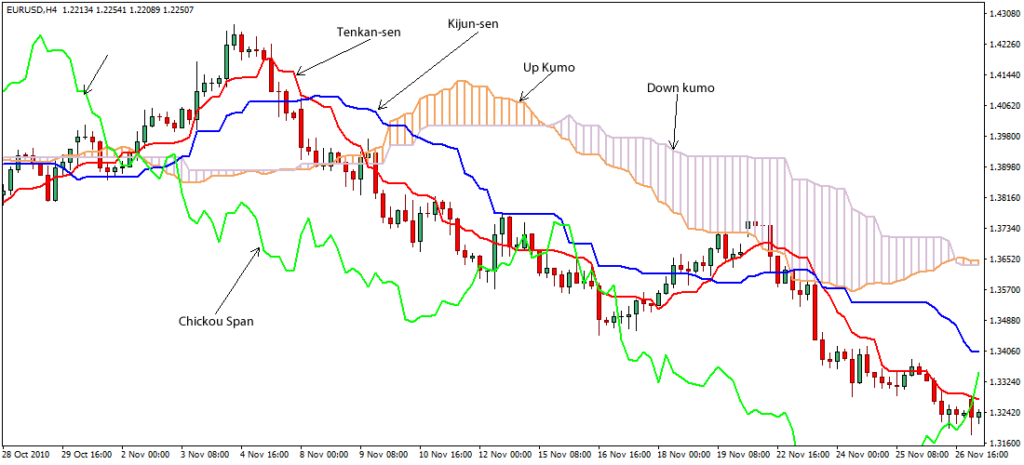
Even though the Ichimoku Cloud has five separate lines, understanding the chart is simple. You must assess whether Leading Span A or Leading Span B is currently higher using the trend lines as seen in the illustrations.
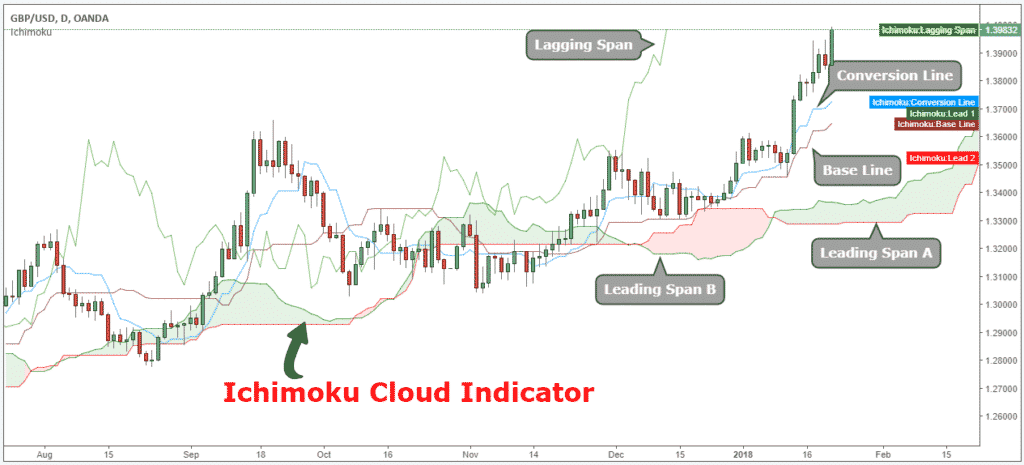
The cloud component of this chart will be colored once Leading Span A and Leading Span B have been established. When Leading Span B is higher than Leading Span A, traders may see that price momentum is increasing. The chart will be colored green if this is the case. When Leading Span A exceeds Leading Span B, the underlying asset is most certainly moving in the wrong direction. The cloud will become crimson when this happens.
Also, you can use the indicator to identify trend movement.
- When the price is above the Cloud, it’s a bullish trend.
- When the price is below the Cloud, it’s a bearish trend.
- When the price is in the middle of the cloud, the trend is consolidating or ranging.
Bollinger Bands
As seen in the image below, the indicator is made up of an upper band, lower band, and Moving Average.
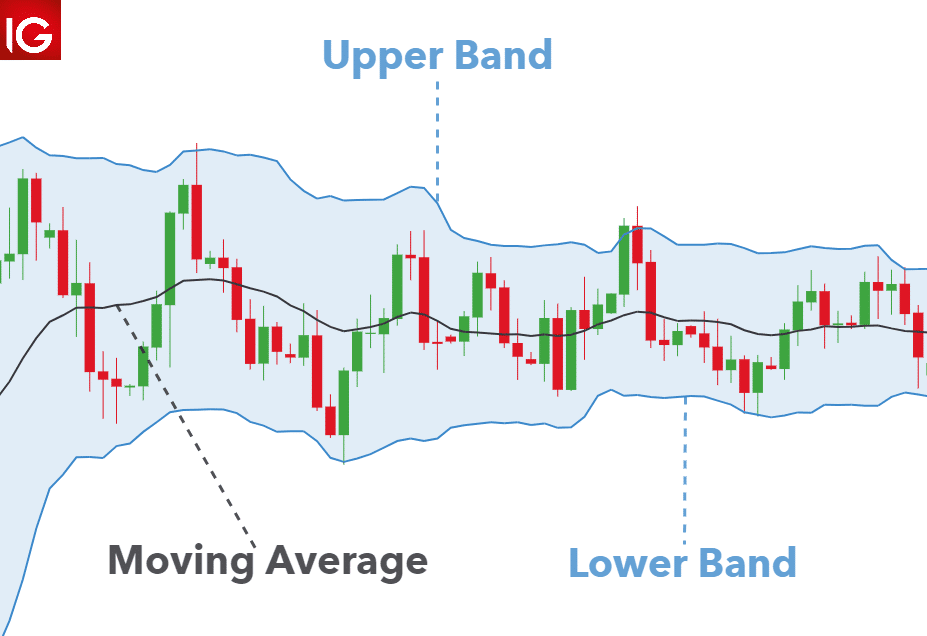
Prices are considered overbought on the upside when they reach the upper band and oversold on the downside when they reach the lower band.
Bollinger Bands effectively gauges volatility when price oscillates between the indicator’s upper and lower extremes. When bands contract, the market becomes less volatile, indicating that a range-bound strategy should be used. As the market becomes more volatile, Bollinger Band will also expand. Traders may use a breakout or a trend-based method at these moments.
The lower band of the Bollinger Band is used as a support. When price touches the lower band, traders use this as a signal to enter a long (buy) trade. This method can be used in both up and downtrends. Depending on the trend, take profit (limit) levels are usually taken from the upper and lower bands depending on the trend.
Hull Moving Average (HMA)
This is a trend indicator. Its purpose is to deliver more high-quality information to people whose trading approach is based on small margins inside an instrument’s price movements.
A mixture of Weighted Moving Averages makes up the HMA. It favors recent price changes over older ones, making it ideal for day trading. As a result, a dynamic yet smooth Moving Average emerges, capable of identifying the dominant market trend.
Look at the HMA example (the blue line) below.
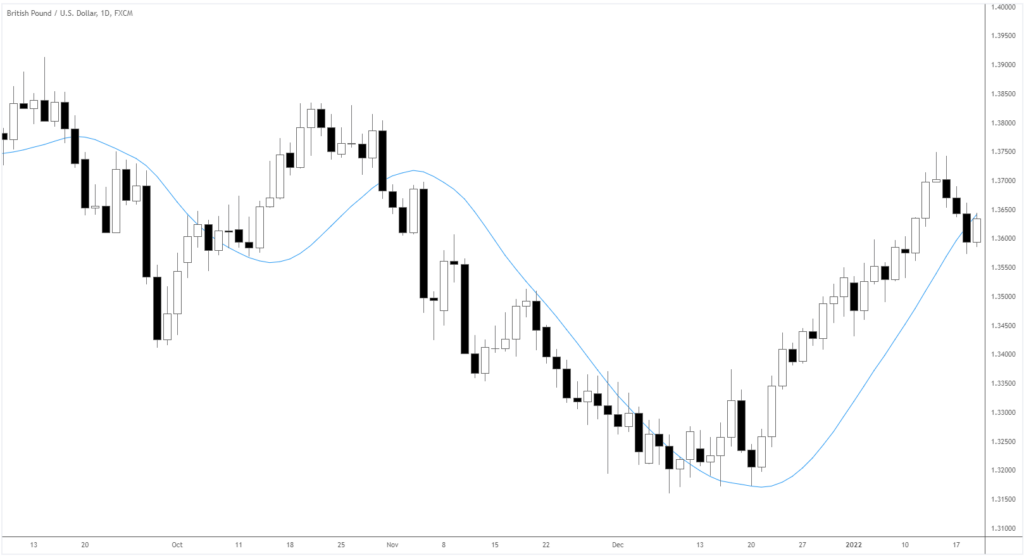
The goal is to locate an asset whose price is rising or dropping throughout the proper period of the indicator for trends identification. If the price of an asset increases, your goal is to keep the HMA below the price. When the price falls below the HMA, a sell-trigger appears.
Donchian Channels
The core idea is to detect breakouts from specific periods. The 20-period setting is the most prevalent. As a result, a breakout occurs when the price trades above or below the upper or lower range.
The illustration below shows the tool applied to the USDJPY.
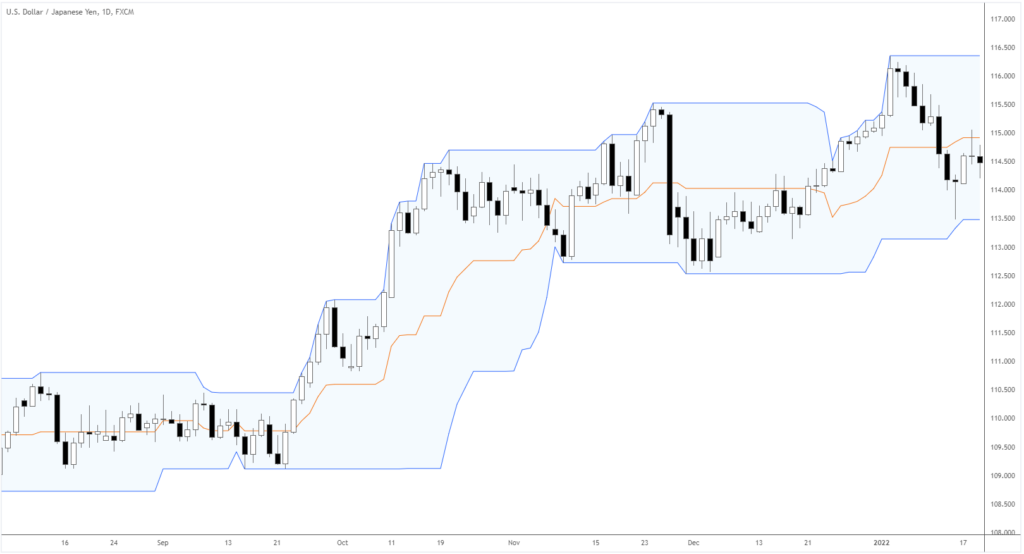
However, because this is based on a trading month (20 trading days in a month), it is best to experiment according to your preferences and timing. When the price breaks above the price from 20 candlesticks ago, it means the price wants to move upward. If the price breaks below the price from 20 candlesticks ago, it indicates that the price wants to go lower.
Parabolic SAR
It is one of the best indicators for day trading since it can be used as a significant reversal indicator and a trailing stop loss monitor. Lower period markets change quickly, thus being able to spot market reversals and lock-in profits are essential.
Look at the SAR that’s applied to the Gold market below.
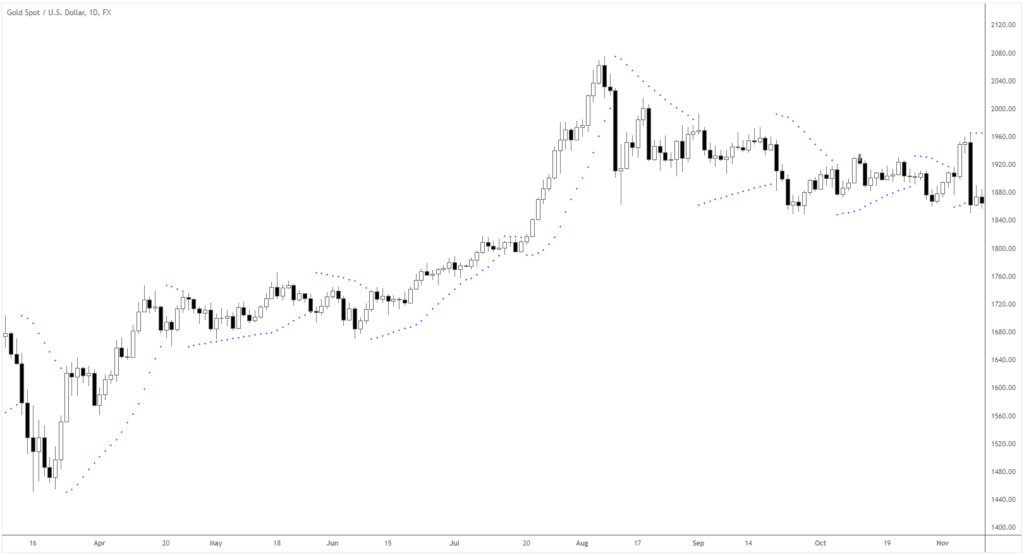
Day traders would expect the market to revert if the price breaks SAR’s line, based on the market forming a parabola. After a brief period of moving in one direction, the parabolic SAR will begin to depict where the markets are likely to reverse. Following a breakout confirmation, day traders would aim to enter a trade once the price breaks this line.
Some traders use the parabolic SAR as a trailing stop loss while they have a position open. This is advantageous since it allows you to lock in profits while you continue to trade.
Summary
Forex day trading is sometimes viewed as a means of generating a quick profit on your investments. Like any other approach, it comes with its own set of risks. Some tools are better suited to day trading since they are more effective in a shorter time frame. A few of these indicators include Parabolic SAR, Donchian Channels, Ichimoku Cloud, Bollinger Bands, and Hull Moving Average.


