
There are various tools that traders utilize to secure an advantage when trading, one of which is the Ichimoku indicator. It is surely one of the tools that traders find overwhelming to look at and understand. No wonder then that many of them end up misinterpreting the signals produced by it. Today, we break down this indicator to simplify and ensure that you won’t be intimidated by this indicator ever again.
What are Ichimoku Clouds?
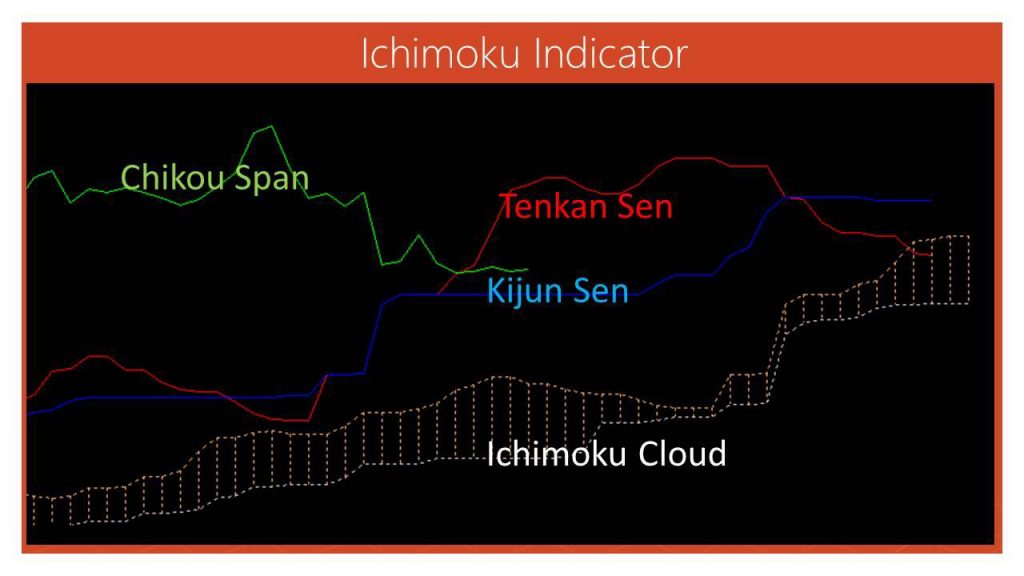
The indicator has inspired a lot of fear and confusion in traders, chiefly because it is a collection of many indicators. However, it is quite easy to use once all the parts are understood. Let’s take it apart one line at a time. The following graph will be taken as a reference to understand its constituent parts.
Tenkan Sen (Red Line)
This represents the average of the highest high and the lowest low that have taken place over the previous nine time-periods. That means, if the indicator is applied to a weekly chart, the tenkan sen line will highlight the average of the highs/lows over the past nine weeks.
It is different from a basic moving average (MA) as it doesn’t add together the average of the highs/lows of every single time period, but gives the average of the entire previous periods. As such, the tenkan sen will indicate a change in the price before a MA will.
Since this component reflects changes in price over the most recent frame, the change in the market is reflected faster – be it a change in direction/trend or momentum.
Kijun Sen (Light Blue Line)
Compared to the previous component, this one tends to be a little on the slower side to indicate the market change. This is the average of the highest highs and lowest lows over the previous 26 periods. However, the importance of this component is in identifying where to place stop-loss orders to enter a trade. When the market moves, it can also be utilized to change the trailing-stop order.
The price movement is indicated by the slope of the line, just as the previous component. This line also constitutes an equilibrium area between buying/selling pressures. Following a temporary retracement in price, the level of kijun sen is considered by many to be a decent level to start a buy/sell position.
The ‘Cloud’ (Senkou Span)
This is the area that is highlighted by red and dark blue vertical lines. It is formed between two lines. These are called Senkou Span A (average of the previous two components, plotted 26 periods ahead), and Senkou Span B (average of highest highs and lowest lows over the previous 52 periods). By plotting ahead the lines that form the extremes of the cloud, it pushes past the last price record, which indicates expected price levels in the future.
The two Senkou span lines and the cloud highlight the support-resistance areas. The main component of the whole system is the cloud as it highlights the whole area of support/resistance, rather than attempting to specify them at any one price point (which is hardly possible).
The cloud deepens and thickens the longer a trend continues in a particular direction. A deep cloud indicates that for the direction to reverse, a substantial price change is required to overcome the support/resistance levels, safeguarding the present trend. It also indicates greater market volatility.
Forex Trading with Ichimoku
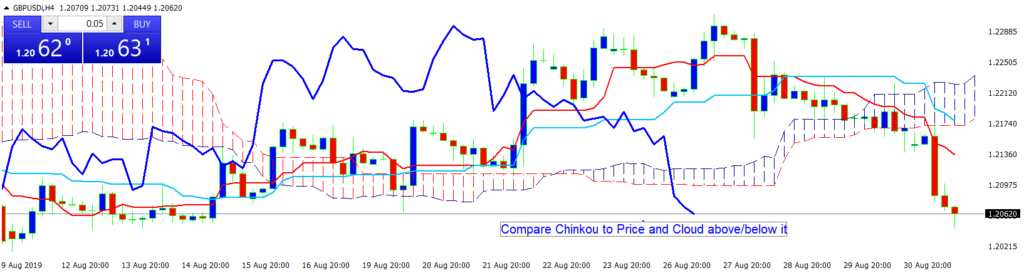
The cloud is used by traders to spot overall trends and establish trading biases. As soon as a bias is established, a trader should wait for corrections when prices cross the Kijun sen line. The signal is triggered when the prices cross the Tenkan sen line, which marks the end of the correction. Let’s see how bullish and bearish biases can be established.
Bullish Signals
The aforementioned strategy should set three criteria for a bullish signal. When prices are on top of the lowest line of the cloud, it is a bullish signal bias. This means that prices are either above the cloud or hover above the support.
Secondly, a bullish signal is identified when the price goes below the Kijun sen line and highlights a pullback. Thirdly, a bullish signal is triggered when prices reverse and move on top of the Tenkan sen line. These three criteria are not met in a single day. It is a process that goes in the same fashion as mentioned, one after another.
Bearish Signals
Similar to the previous bias, a bearish signal also has three criteria, which also occur one after the other over a period of time.
Firstly, the prices have to be under the highest cloud line, which represents that the price is either under the cloud or yet to break above the resistance. Secondly, the price has to move beyond the Kijun Sen line and indicate a bounce back within a larger downtrend. Lastly, the price has to reverse and go below the Tenkan sen line.
Recap
To understand the process better, let us revisit the information in brief. The Ichimoku Cloud is comprised of multiple lines, each of which is important in highlighting a particular aspect of the price movement. The crossover between them provides additional information that allows traders to open/close positions as per the following:
- Look at the Kijun/Tenkan Cross: The crossover of these lines works similarly to that of the MA crossover. This allows for the isolation of price action movement.
- Corroborate the Up/Downtrend: Make sure to confirm that the crossover is in line with the market sentiment as this will improve the probability of the trade.
- Price action breaking through the cloud: The up or downtrend must make a visible break through the cloud of resistance/support. This will ensure that the probability of the trade is high and works in the trader’s favor.
On top of that, it is important to control one’s position by ensuring adherence to strict money management.


