
- China’s PMI decreased by 0.6 points from the projected 51.6 in January 2021, indicative of slight manufacturing growth into 2021.
- China was the only major economy to register a positive GDP growth in 2020.
- The US is expected to increase its factory sales in 2021 after the implementation of Biden’s stimulus.
The US dollar continued to fall, pulling the USD/CNY lower amid calls from Congress members that the Biden stimulus package should be recurring. The fourth quarter (Q4) of 2020 saw the downshift of the US economy. Expenditures among Americans into 2021 decreased as the labor market shrank to record lows in 2021. However, the US GDP growth into 2021 by an annualized rate of 4% and expanded investment in light of the new stimulus bill presents a good recovery option for the dollar. Further, the yuan is facing headwinds from slow factory growth in 2021.
China’s factory data
China’s manufacturing Purchasing Managers Index (PMI) data fell by 0.6 points from 51.9 in December 2020 to 51.3 in January 2021. The index is still above the 50-point threshold that means the Chinese economy is still on a growth course. Market data also shows that while most nations were reeling from the raging impacts of COVID-19 in 2020, China’s economy grew closer to that of the US.
China’s GDP in 2020 grew by 2.3%, indicating a V-shaped recovery, although it was the first country to issue lockdowns. Regarding exports, the trade surplus hit a record high of $535 billion (in December 2020 – the highest since 2015). We can guess that this increase in exports was motivated by surging demand for COVID-related products and services. In 2021, further growth is expected in the automotive category, furniture, and electronics.
Slow US economy growth
The US economic output decelerated below the 33.4% rate in Q4 2020. Applications for unemployment benefits in the US eased to 847,000 (a decline of 67,000) by January 21, 2021. The period also saw a sudden moderation of consumer expenditure while personal consumption increased by 2.5%. This rise fell 0.6% short of the projected rate of 3.1%. The construction rate was powered by increasing home sales that made more companies invest in equipment sales. We perceive a rebound in manufacturing due to a rise in equipment sales that will accelerate US factory data into 2021.
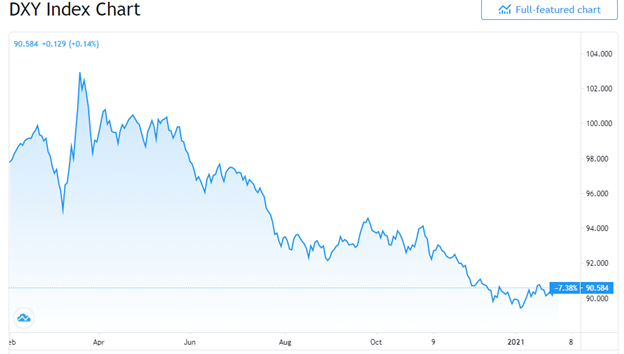
Although the US dollar index has fallen by 7.63% since 2020, it has increased by 0.34% to reach 90.536 in the week ending January 31, 2021. The dollar index tracks the greenback’s growth against other leading currencies based on their weighted average in the market.
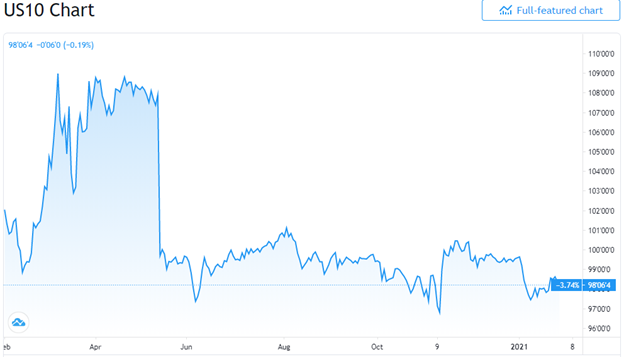
The US 10-Year Treasury Yield also increased by 0.18% in the week leading to 31st January 2021, indicating an uptrend of the US economy. While the Federal Reserve has downplayed the raising of interest rates, the boost of Biden’s stimulus is likely to cause reflation by an increase in output. We expect an increase in US manufacturing prices in 2021 and the PMI, which indicates higher factory prices as the economy resurges.
Technical analysis
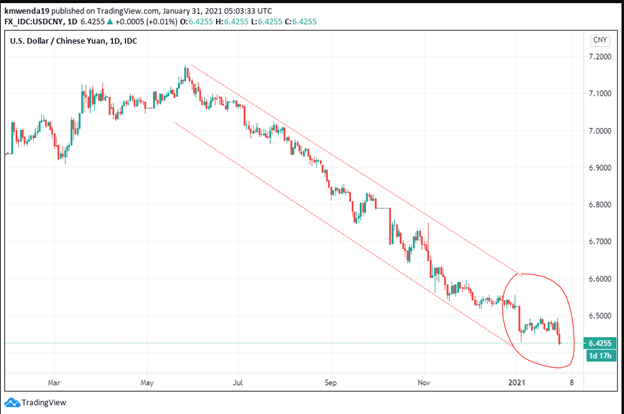
Major pivot points such as the Classic and Fibonacci trend lines stood at 6.4307, indicating a bearish position for the USD/CNY trading pair. The 14-day RSI also supported a sell position at 25.540. The 14-day average true range (ATR) indicated less volatility of the trading pair showing some growth sign in the long-run. The 50-day moving average worked out as a resistance level at 6.4632 below 6.4278. The 200-day SMA stood at 6.4705 as of January 31, 2021, proving the dominant sell position against the US dollar.


