
Even if you are a complete newbie to forex trading, you must have looked at the support and resistance levels in the market to make trading decisions. They represent the most basic and common form of technical analysis out there today.
However, most traders don’t really know the exact theory and application of Support and Resistance lines on their charts. So before delving in-depth, let us first understand what these levels indicate.
Read on to understand how it can help you figure out turning and entry points and build a more thoughtful trading strategy.
Support and resistance defined
Simply put, Support represents areas where price has reacted to in the past and can “potentially” react to again in the future. There is an old saying that history tends to repeat itself. In Support and Resistance or supply and demand type trading, we are looking to do just that. Identifying Vs and upside-down Vs is a key way to identify the supply and demand on charts.
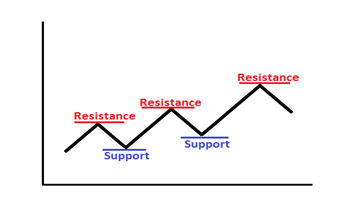
The graph depicted above further illustrates this concept. When the declining prices stop, turn around, and start to increase, the lowest point attained before it started back is termed as support.
Since it supports the falling prices, it acts as a “floor.” When the rising prices stop, change direction and pull back, the highest point reached before it moved back is resistance. It can be compared to a “ceiling” because it caps further advancement in price levels.
In a specific time frame, resistance and support levels keep forming as many times the price levels change.
The relevance of support and resistance
A crucial skill that distinguishes a flourishing trader from a novice is the evaluation and interpretation of price charts. In order to make high precision trading decisions, first become handy at analyzing the charts for support and resistance levels. Given below is an instance of a price chart from the real world.
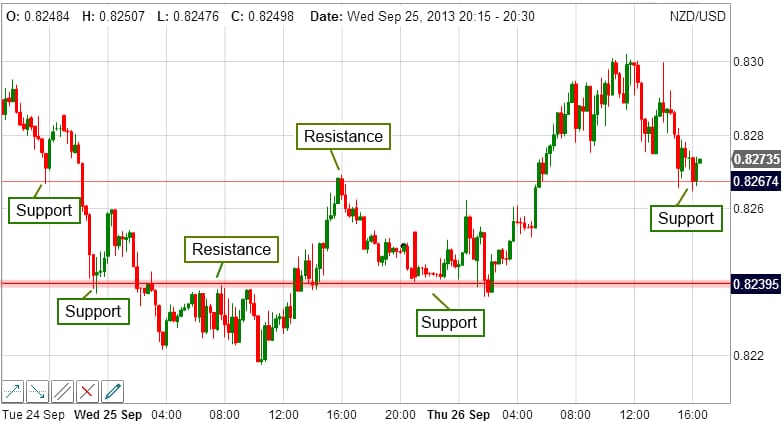
The chart clearly depicts that the market is moving up and down in a zig-zag fashion. Price attains a certain level and is then forced to change direction. ‘V’ shaped valleys denote levels of support where there is a surplus of buyers. While the upside-down ‘V’s indicate the points of resistance where there is a surplus of sellers. It is also worthy to note that the red horizontal lines depict the areas where the price is affected and gets turned around. In other words, price bounces off repeatedly in this region. Eventually, it manages to break through this level and reaches 0.83.
Keeping the support and resistance levels in mind, the following inferences can be drawn:
Trend lines and their significance
Trend lines are horizontal or angled lines that show how the market is moving. It is a great tool to analyze the current trends in the market and to spot the “potential” trading opportunities. For plotting trend lines, you require a minimum of two points of high or low swings in the market. Lows of uptrend and highs of downtrend are taken into account. Connect those points and extend the line to predict where the Forex pair is likely to ensue a move in the opposite direction. Just remember that drawing these lines over higher time frames is more profitable.
How to trade according to the support and resistance levels
The most basic clue that can be sought from these levels is to trade the “bounce.” Buy near support in an uptrend market and to sell near resistance in a downtrend market. It is always advisable to wait for a confirmation of the trend. Then make a short trade if the price crosses the assumed high (in case of support), and the assumed low (in case of resistance). In addition, keep a target price in mind to make profitable trades.
To interpret the support and resistance levels, there is yet another approach – trading the “breaks.” If the price breaks up through resistance, it is a signal to buy. On the flip side, if the price breaks down through the support, it is viewed as a signal to sell. However, this method is less commonly used.
Major vs. minor levels of support and resistance
Depending on the market movement, support and resistance levels are classified as major and minor. Major support and resistance areas are very pronounced and easy to see. They are ultimately responsible for trend reversals. Minor levels do not hold the prices. Assume that the price is moving high in an uptrend when suddenly a little pullback in price occurs. After this, it gets bounced off to make higher highs. This pullback represents a region of minor support. Clearly, the market moves in these areas are not very large.
Final thoughts
Support and resistance levels are a gift to traders, especially in the forex market. The better you familiarize yourself with these, the simpler it becomes to make trading decisions. But you will need the willingness to practice – you must be prepared to work on the ranges and chart patterns. Study in-depth to identify the key levels of support and resistance. Even those who are new to trading can gauge the underlying movement of the currency pairs in the market and then decide when to open and close positions.


