Do you want to get a timely trading signal while still filtering out the market noise? The right set of indicators can help you have the edge in identifying trading setups. Indicators deployed in technical analysis are broadly classified into two: leading and lagging. Understanding the difference between the two and how they respond to price changes is crucial to profitability.
Lagging vs. leading indicators
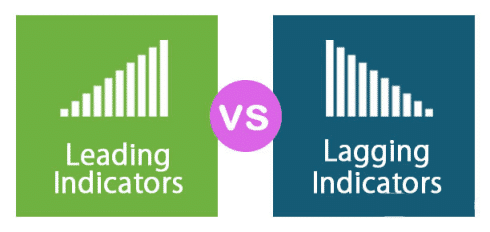
The main difference between lagging and leading indicators is how they respond to price changes. While leading indicators move ahead of price, signaling upcoming price movements, lagging indicators lag and only confirm price movements once they occur.
Unlike lagging indicators, leading indicators respond to price quickly, therefore ideal for traders looking to profit from short-term price movements. The indicators are commonly used in scalping and day trading.
While leading indicators predict upcoming price movements, they are prone to providing false signals. A leading indicator can signal it is time to enter a trade only for the price to change direction and move in the opposite direction.
Lagging indicators are slow in reacting to price changes. Likewise, such indicators work well with long-term trading strategies such as positional trading. In this case, such indicators provide reliable signals about long-term price movements.
The biggest drawback to lagging indicators is that their sluggishness in responding to price changes often leaves traders at significant risk of entering trades late into the game.
What Is a Leading Indicator?
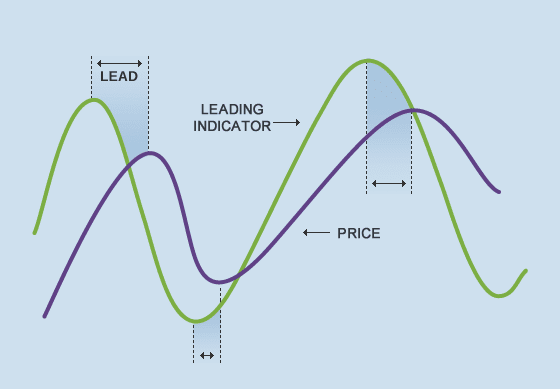
A leading indicator is a tool used in technical analysis to anticipate a market or price direction. The indicators allow traders to predict price movements ahead of time. Thus the name “leading.” An effective leading indicator will enable traders to open trades before markets start moving.
How to identify a leading indicator
By definition, a leading indicator is one that will generate price movement signals before they happen. It follows that if the standalone indicator in question is able to forecast trend changes and/or continuations, you have yourself a leading indicator.
On the flip side, if your indicator generates signals confirming a price trend after it has started, it is a lagging indicator. In addition to the aforementioned leading indicators, several other useful indicators can help you identify trading opportunities in various markets. Let’s dive into one that is perfect for stocks and very useful for forex.
Best leading indicators for momentum trading
Leading indicators are widely used in short-term technical analysis as they predict price movements before they occur, allowing traders to get ahead of the momentum. Some of the well-known leading indicators include:
- Relative Strength Index
- Stochastic Indicator
- On Balance Volume
- Williams %R
- Fibonacci retracements
- Awesome oscillator.
Best leading indicators for day trading
If you intend on doing short-term trading, holding your positions for no longer than a day, here is the list of best leading indicators for day trading you could employ.
- Pivot points.
- Fibonacci retracements
- On balance volume
- Awesome oscillator
- Ichimoku cloud
Relative Strength Index
Relative Strength Index is commonly used in technical analysis to warn traders about overbought and oversold conditions. Whenever faced with these conditions, traders usually anticipate price reversals. RSI is often a confirmation signal in leading indicators trading systems.
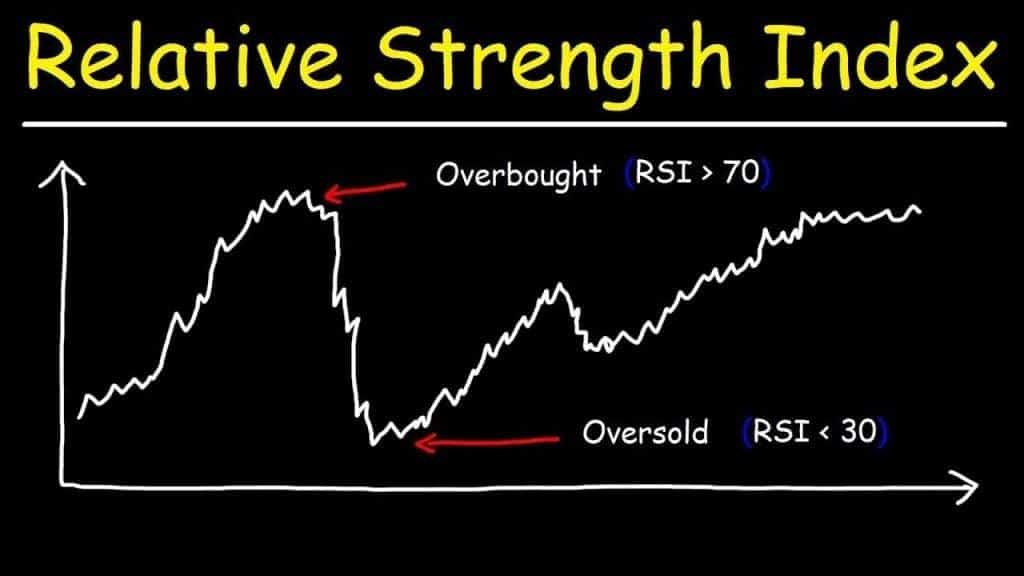
The RSI has readings of between 0 and 100. Readings above 70 are associated with overbought conditions. In these conditions, traders are usually cautious about entering long positions, given the increased risk of price reversal.
Readings of below 30 signal oversold conditions. Likewise, technical traders refrain from entering short positions, given the increased risk of price reversing and moving up.
While using the RSI, it is essential to note that the price might remain overbought and oversold condition much longer. It is one of the biggest risks associated with the RSI leading indicator.
Pros
- It’s a straightforward indicator that’s easy to use.
- It can be used in different market environments.
Cons
- May provide misleading information in the middle of a trend.
- When RSI is at 50, it doesn’t provide definite signals.
Stochastic Oscillator
The stochastic oscillator is a momentum indicator that operates the same way as the RSI indicator, signifying overbought and oversold conditions. The indicator is based on the idea that market momentum changes direction much faster than volume and price.
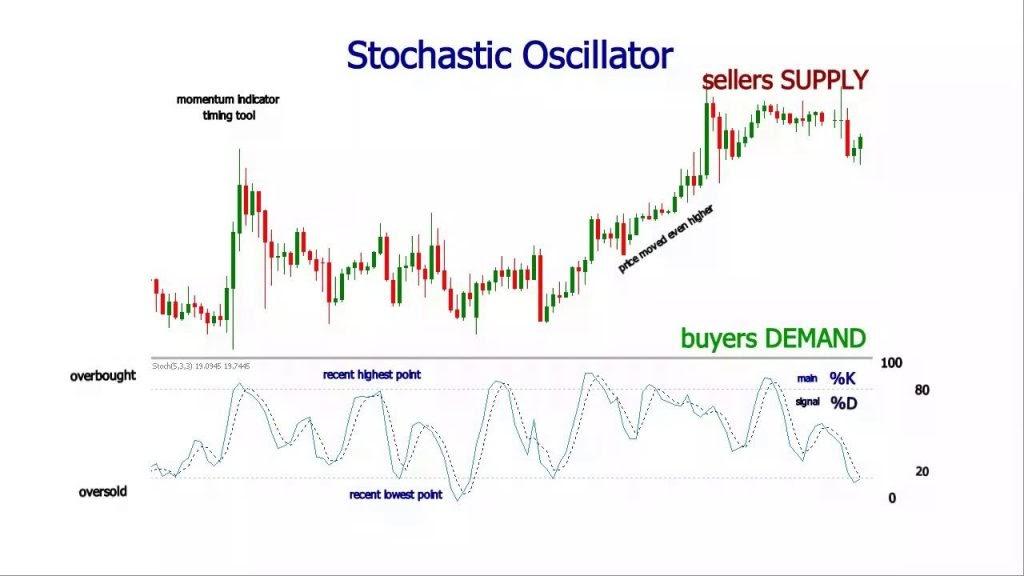
The indicator comes with readings of between 0 and 100. Readings above 80 signify overbought conditions, while anything under 20 is interpreted as oversold. Unlike RSI, Stochastic responds much faster to price changes.
Pros
- Stochastic provides frequent signals.
- It’s simple to interpret the indicator.
Cons
- It can generate too many false signals.
- May stay at extreme levels for a long time during the trend.
On Balance Volume
On Balance Volume Indicator focuses on volume to enable traders to make predictions in the market. An increase in a given instrument’s trading volume will often result in the indicator rising, signaling a potential spike in price.
A decrease in volume in a particular direction would often signify exhaustion, warning of potential price reversal. Like other leading indicators, the OBV indicator is prone to false signals, especially during market-moving events resulting in huge volume spikes.
Pros
- The indicator is good at confirming trends.
- It’s helpful in understanding what institutions are doing.
Cons
- The reading of OBV may be distorted due to non-standard events, such as news releases.
Williams %R indicator
The Williams Percent Range indicator bears a close resemblance to the stochastic oscillator. It ranges from 0 to -100 and measures oversold and overbought conditions. It compares a currency pair’s close to the high-low over a specified period. This is usually a 14-period duration.
A reading from 0 to -20 signifies overbought conditions, while -80 to -100 is the oversold range. Oversold and overbought conditions do not necessarily predict a trend change. Overbought simply means that the current close is near the highs of the last 14 periods. On the other hand, oversold means that the current price is nearer to the lows of this period.
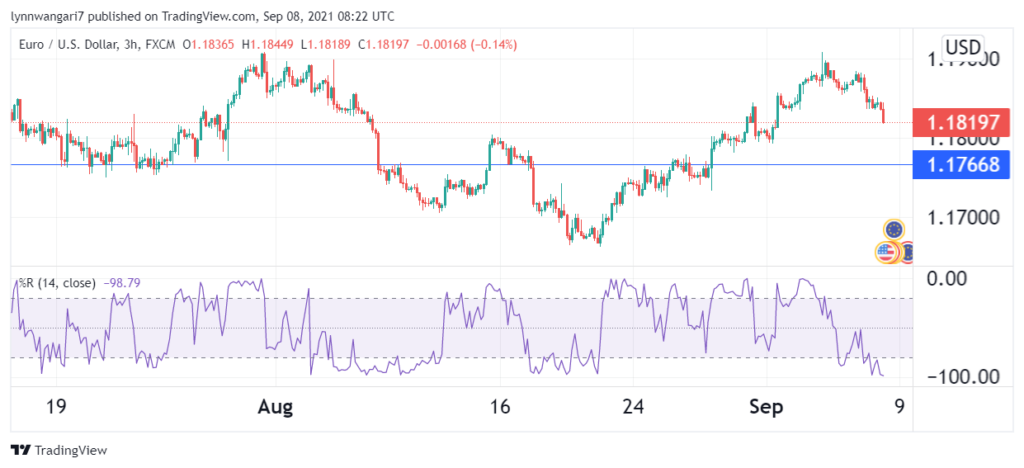
From the 3-hour EUR/USD chart above, if the indicator rallies upwards, prices follow suit. If it falls drastically, prices will soon follow the downtrend.
Pros
- It is simple to understand.
- It is very visual.
Cons
- It uses a negative numbers scale which can be confusing.
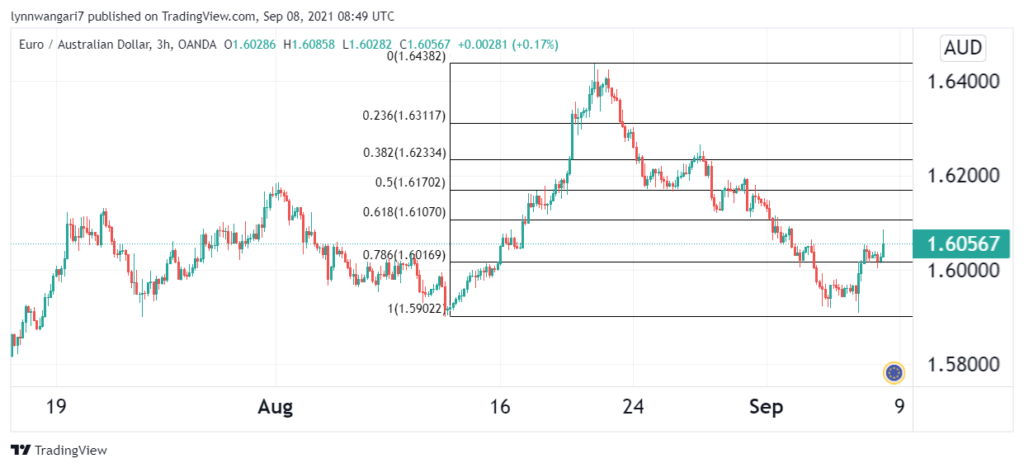
Fibonacci retracements
The general idea behind Fibonacci retracements is that price often retraces back to find a predictable area of support before resuming its original trend. This indicator provides these levels of support/resistance.
The chart below shows that the EUR/AUD price fell after a significant bullish run. As it fell, it found support at the 50% Fibonacci retracement level before resuming an upward rally. It then fell again to find support at the 61.8% retracement level before it staged a downward breakout.
Pros
- It helps point out entry and exit signals, and where to place stop losses.
- It identifies accurate supports and resistances.
Cons
- It often is dependent on the vision and skill of the individual analyst.
- It can be highly inconsistent at times.
Awesome Oscillator (AO)
The Awesome Oscillator is a momentum indicator obtained by subtracting a 34-bar Simple Moving Average from a 5-bar SMA. In essence, the AO compares the momentum of the five most recent bars to that of the last 34 bars. It indicates who is dominating the market between the bears and bulls.
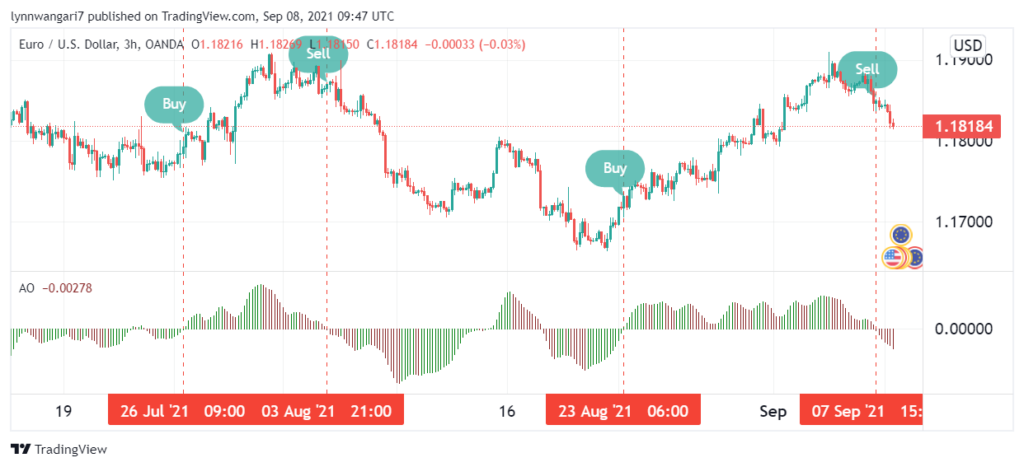
From the 3-hour EUR/USD chart above, it is clear that bulls have the upper hand when the awesome oscillator is positive. When it is in the negative zone, bears dominate the market. When it crosses at zero, the indicator gives entry and exit signals.
Pros
- It tracks the momentum of the market to generate price movement predictions.
- It is suitable for pointing out divergences with a price.
- It works well when the market is trending.
Cons
- It is susceptible to whipsaws if used incorrectly.
- It’s not sufficient as a standalone indicator. It needs to be used with other indicators for proper analysis.
The best leading indicator for the stock market: Average True Range
The Average True Range is an indicator that measures the volatility of a stock price. Usually, increased volatility points to a trend reversal in the markets, while a decrease in the same will indicate a continuation of the current trend.
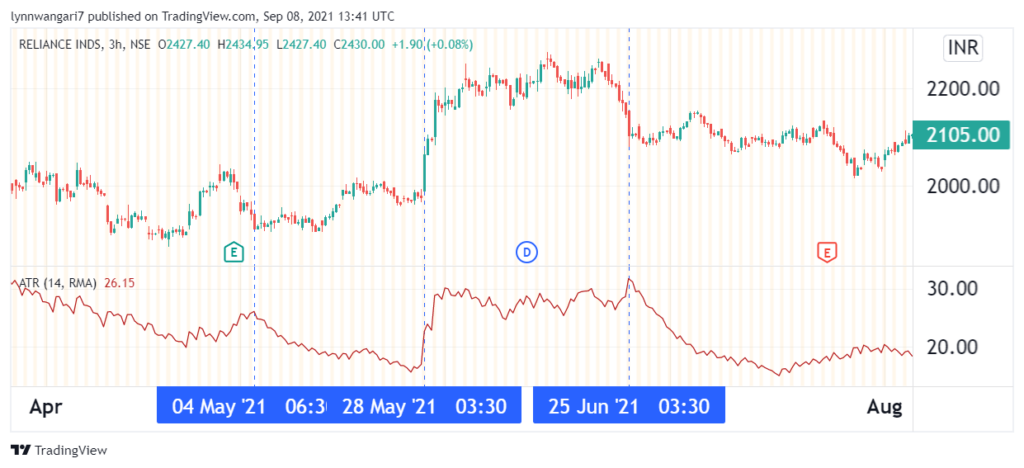
In the 3-hour chart of Reliance Industries stock, it is clear that the average true range indicator showed spikes just before a trend reversal happens. These spikes are highlighted in the blue dotted lines. Therefore, during low volatility spells, you can extend your profit margins. However, when the volatility spikes, you’ll be better off trading the imminent reversal.
Pros
- It g,ives excellent signals when the market is trending.
- It is great at spotting volatility.
- It works well at filtering trades.
Cons
- It does not take price direction into account.
- It needs to be combined with other indicators for accurate analysis.
Top forex leading indicator: the Ichimoku cloud
Also known as the Ichimoku Kinko Hyo, the Ichimoku cloud is a multilayered indicator that can help you develop a complete forex trading strategy.
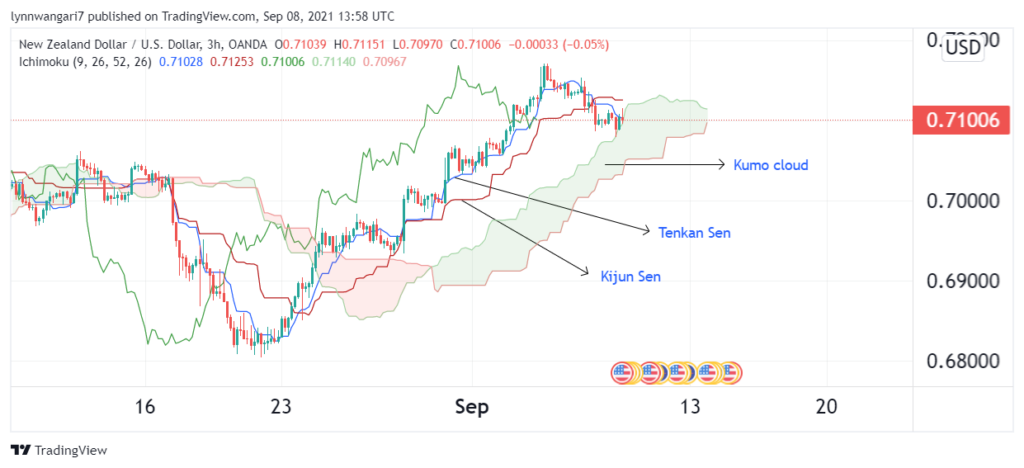
The Kumo cloud is one very important aspect of this indicator. Whenever the price is below this Kumo cloud, the market is in a bearish trend. Alternately, when prices are trading above it, the market is in an overall bullish trend.
Further, Kijun Sen and Tenkan Sen are two elements of the Ichimoku cloud made from Moving Averages. They both follow the price, and any rejection from them generates a possible trade entry.
Pros
- It is concise.
- It is simple to read.
- It is automated, so it doesn’t require a lot of user input.
Cons
- It cannot be customized.
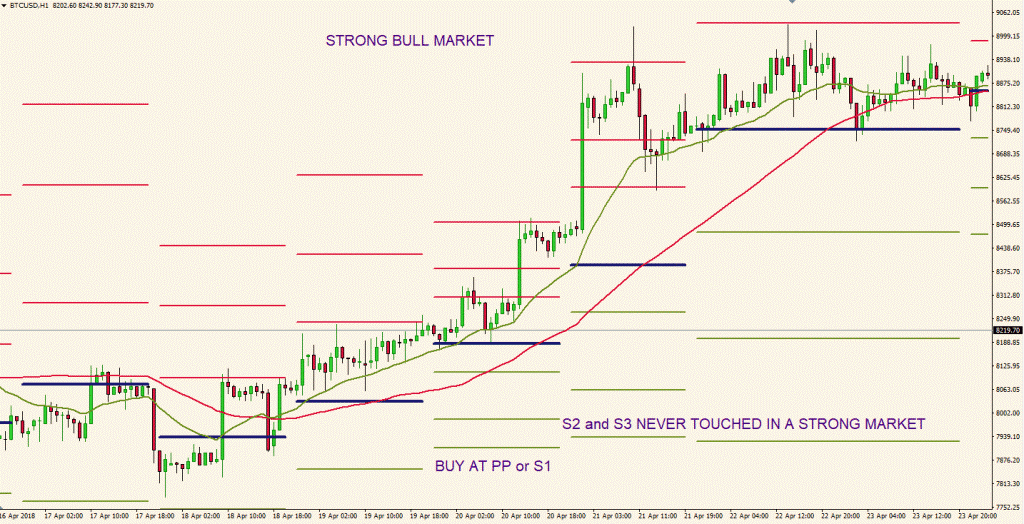
Pivot points
Floor traders use pivot points to indicate the direction of price movement and potential regions of support or resistance. This indicator displays the equilibrium level of supply and demand of a commodity. When the price hits a pivot point, the commodity’s supply and demand are equal, and this is where most of the trading happens. From this point, usually, the direction of price movement changes.
Each day’s pivot points are calculated from the previous day’s high, low and close. They provide a reliable leading indicator mainly because they are based purely on price.
Pros
- It’s an accurate leading indicator.
- The indicator generates valid support or resistance levels.
- Most participants in the market utilize pivots.
Cons
- May provide false signals on non-trading days.
- It needs to be combined with other indicators to generate better entries.
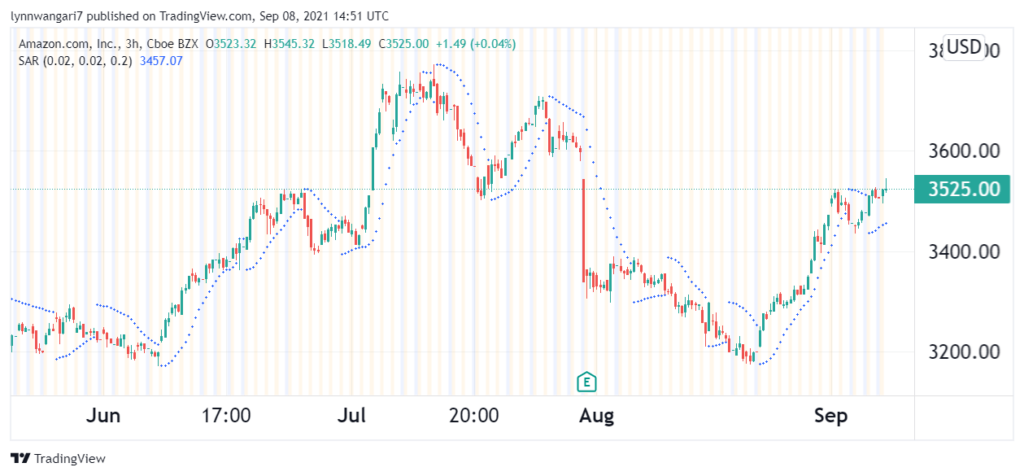
Parabolic SAR
The parabolic SAR is an indicator used to determine the market trend of security and indicate when its price direction is changing. When the price is trading above the parabolic SAR, the market is in a bullish trend. Conversely, when prices are below this indicator, the market is in an overall bearish trend.
Pros
- During a strong trend, it indicates when to hold your position.
- It gives exit signals when there’s a reversal move.
Cons
- It doesn’t generate viable signals when the market is in consolidation.
- When the market is not trending, the indicator fluctuates above and below the price.
What is a lagging indicator, and why use them?
A lagging indicator provides a delayed signal on price movement. Such indicators provide signals once the price has moved or is in the process. Traders use lagging indicators to confirm trends before entering trades.
Opposite to the leading price forecasting tools, lagging indicators serve to confirm fast-generated alerts and filter accurate signals from false ones. Here are the most useful lagging indicators for traders with a more conservative mindset.
Best lagging indicators
Lagging indicators are used to filter noises in the market that often see leading indicators provide false signals. While filtering noise, they can provide accurate signals of long-term trends.
Some of the commonly used forex lagging indicators include:
- Moving Average
- The MACD Indicator
- Bollinger Bands
- Keltner channel
- Triple Exponential Average (TRIX)
- Average Directional Index (ADX)
Moving Average
A Moving Averages is a lagging indicator as it is based purely on historical data; Buy and sell signals are generated on the price rising above and below any Moving Average.
For instance, a positional trader would enter a long position as soon as the price rises and closes above the 200-day Moving Average. Likewise, a trader can use this opportunity to complete any short position as price rising and closing above the 200-day MA, which often signals the start of a long-term uptrend.
The fact that the Moving Average is slow to react to price changes sees them provide more accurate signals than leading indicators when it comes to long-term trading.
Pros
- Markets interact with MA as it’s one of the most popular indicators.
- It’s simple to understand and use.
- It can be used in conjunction with many other indicators.
- It provides potential support and resistance.
Cons
- It often doesn’t represent the recent market data accurately as it may give too much weight to the old prices.
- It may identify the market state incorrectly when flattening for a short period of time.
MACD indicator
Whenever Moving Averages are used in pairs, they often give rise to the Moving Average convergence divergence indicator. The MACD indicator uses two Moving Averages, one that is fast-moving and the other one slow.
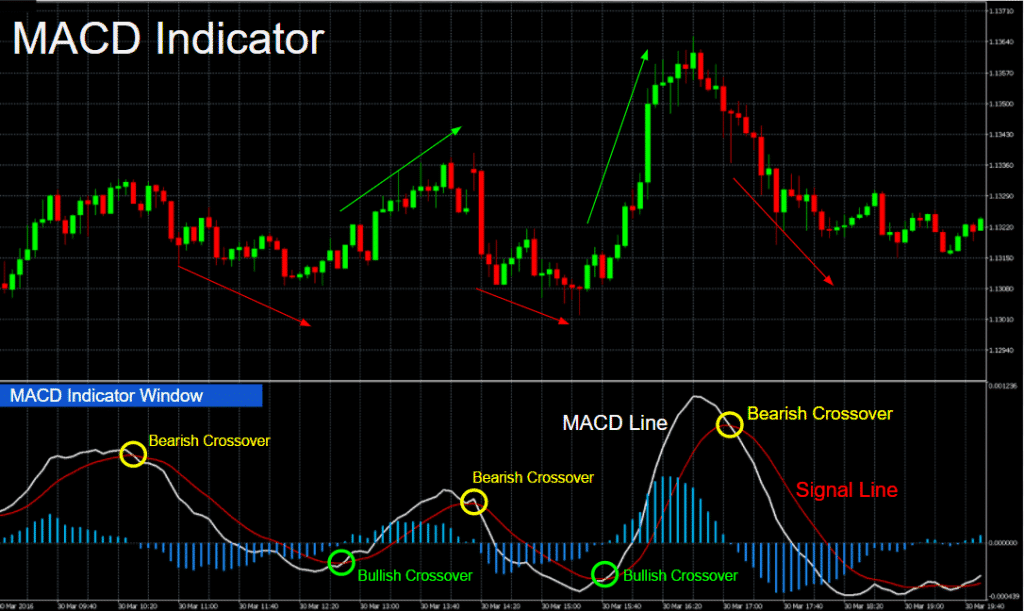
Similarly, whenever the fast-Moving Average rises and crosses the slow Moving Average, it acts as a buy signal. Whenever the fast-moving drops below the slow Moving Average, the same signals a potential sell signal.
The indicator also comes with a histogram that is used to anticipate crossovers between the two Moving Averages. The size of the histogram indicates the difference between the Moving Averages. As the size increases, the same indicates Moving Averages are diverging and moving further apart.
Pros
- MACD generates two kinds of signals.
- It’s quite self-sufficient, not requiring other indicators to confirm its signals.
Cons
- MACD generates two kinds of signals.
- It’s not designed for long-term trading.
Bollinger bands indicator
Bollinger band is an indicator that stems from the Moving Average. It is made up of a Moving Average in the middle of two standard deviations located above and below it. These two standard deviation lines act as support and resistance levels.
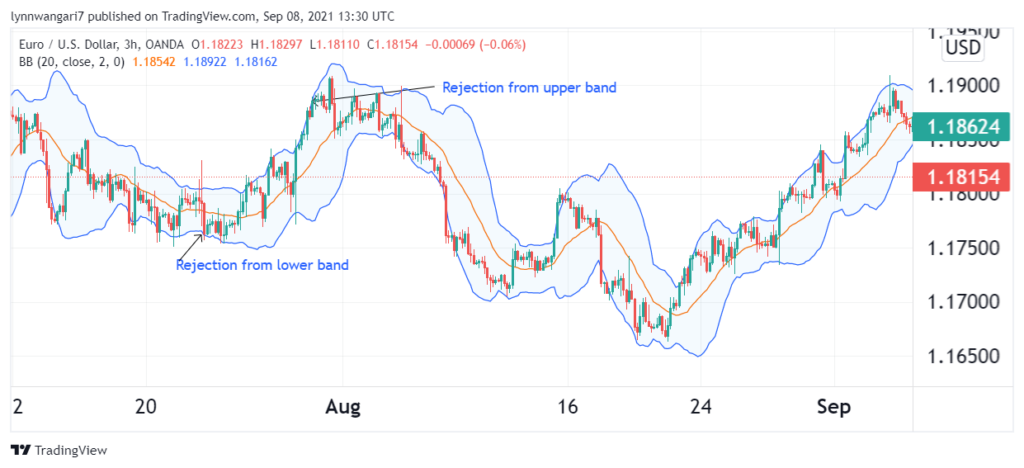
As seen from the EUR/USD chart above, a rejection from the lower band gives a possible entry. On the other hand, a rejection from the upper band indicates a possible exit. Additionally, when a candle closes below or above the middle MA, it indicates the possibility of price testing the next level.
Pros
- It’s a multi-purpose indicator, showing the beginning and the end of trends.
- It’s easy to use when plotted on the chart automatically.
Cons
- It should be combined with the other indicators.
- It provides entry signals after the initial impulse.
Keltner channel indicator
The Keltner channel indicator is obtained by combining the exponential Moving Average and average true range indicators. It consists of a 20-period EMA with an upper and lower band. These bands are usually at a distance of two times the ATR value above and below the EMA.
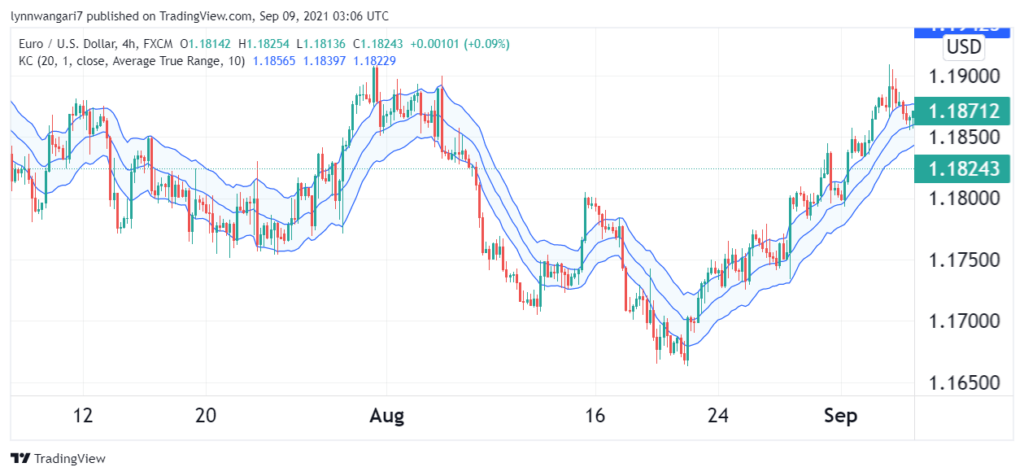
From the figure above, when the price reaches the upper band, the market is in a bullish trend. When prices fall to reach the lower band, the market is bearish. In addition, the two bands act as support and resistance levels when the price is oscillating between them.
Pros
- The indicator is good at pointing out the prevailing market trend.
- It provides dynamic areas of support/resistance.
- The indicator can be used to measuring market volatility.
- It can be used to display overbought and oversold areas.
Cons
- It needs to be used with other indicators for proper analysis.
- It doesn’t predict price movements. It only confirms them.
- It doesn’t identify cycle turns accurately. It is prone to false signals.
Triple Exponential Average (TRIX)
Here is another lagging indicator that’s based on three Exponential Moving Averages. TRIX is an oscillator, that similarly to others has positive and negative values.
In the context of momentum trading, the positive indicator’s value suggests that the momentum is increasing, and when the readings are below zero, the momentum is cooling off.
TRIX may provide a buy signal when it crosses above zero and a sell signal when it dips below zero. Divergencies are another kind of signal that the indicator can generate.
Pros
- TRIX filters out the market noise better than the majority of trend-following indicators.
- The indicator can be interpreted as the leading one.
Cons
- It may provide a too general view of the market cycle.
- It needs to be combined with the other indicators to produce accurate signals consistently.
Average Directional Index (ADX)
The indicator offers traders several ways of usage. ADX can show the current market state and measure the strength of the trend.
As the Average Directional Index is based on the Moving Average that’s calculated of price expansion, the indicator is still classified as lagging. The indicator is unique in the way that it can be seen as the leading one, as it shows a strength of a trend before a possible breakout.
The readings below 20 indicate the range market, especially for an extended time. When the indicator is above 20, the market turns into a trend. The higher the reading above 20, the stronger the trend.
Pros
- ADX enables traders to identify the market state more accurately than other lagging indicators.
- It’s a multifunctional indicator that can be helpful for different trading systems.
Cons
- It may disregard the market as a trend when too lengthy interim correction occurs.
- The primary function of the indicator doesn’t include entry signals generation.
Are leading indicators only for technicians?
As a matter of fact, there are also leading, lagging, and coincident indicators that describe the economy’s state. Like leading technical indicators, leading economic indicators are statistics that predict the economic performance of the whole country. Coincident indicators are statistics that come out during the trend, such as the employment situation summary. Lagging indicators, on the other hand, come after the trend. They confirm or disprove the trends forecasted by leading indicators.
Best leading macroeconomic indicators
These indicators are mainly used in the stock market as they provide better signals for stocks analysis. They include;
Bond yields
Yields from long-term Treasury bonds are plotted against short-term Treasury bills on a curve known as a yield curve. In normal conditions, yields from short-term bills are lower than those from Treasury bonds. This means that investors have such faith in the economy that they are willing to wait long periods to gain higher returns.
When short-term bills offer higher returns than the longer-term bonds, the yield curve inverts. An inverted yield curve often precedes a recession because it means investors do not have much faith in the economy’s longevity.
Durable goods orders
The durable goods orders report indicates how much companies spent on large, expensive items such as machinery, vehicles, or airplanes. When the economy is failing, companies will avoid large spending on such items. However, if the economy is flourishing, these industries will want to upgrade their infrastructure to meet the revamped demand.
Housing starts
For single-family houses, condominiums, and co-ops, the National Association of Realtors (NAR) offers an existing home sales report on the number of used properties sold each month, as well as the prior month and previous year input. This report includes information on inventory, prices, and regional sales performance based on actual house sale closings.
Building Permits
Building permits are legal permissions or authorizations provided by the government or other regulatory agencies to legally construct a new or renew existing real estate. The US Census Bureau compiles the data and publishes the overall number of building permits every month. The survey is conducted once a month and covers around 9,000 permits across the country. When permits reduce, it means something is wrong with the real estate sector. Since it’s a vital part of the economy, the effects reverberate throughout the whole economy.
Index of leading economic indicators
The Index of leading economic indicators (LEI) is used to forecast future economic activity. LEI is released monthly. Usually, three consecutive readings in the same direction point to a shift in the economy’s direction. Therefore, three negative readings over a quarter would indicate that a recession may be imminent.
Bottom Line
Leading and lagging is a broad classification of indicators used in technical analysis in price determination. While leading indicators respond to price changes fast and attempt to forecast future price movements, lagging indicators use historical data, thus slow to respond to price changes, therefore the delayed feedback.
The delayed feedback by lagging indicators means they are ideal for long-term trading strategies where confirmation of market trends is essential. On the other hand, forex leading indicators are commonly used in short-term trading strategies where traders profit from short-term price movements.


