
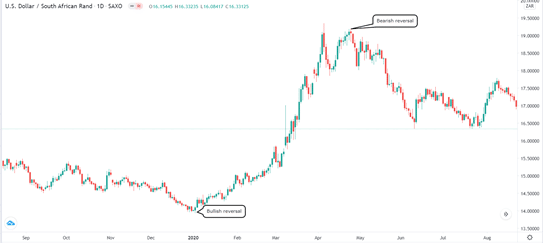
A reversal happens when the price of a financial asset changes its direction. The reversal can be bullish, where the price of a falling currency pair starts rising. It can also be bearish, when the price of a pair starts rising. Trading reversals combines skills in price action, fundamental analysis, and technical analysis. The strategy can be used in scalping, day trading, swing trading, and long-term trading. The chart below shows the two types of reversals.
Bearish and bullish reversals
Why reversals happen
Forex reversals happen because of three primary reasons. First, they happen when the fundamental story starts to change. This could be a sudden change of policy by a central bank, results of a presidential election, and strong employment numbers.
Second, reversals happen because of technical reasons. For example, a currency pair can suddenly get overbought, leading buyers to start taking profits. Finally, they happen because of psychological reasons.
Trading forex reversals using technical indicators
Indicators are tools used by traders to assess financial assets in the market. They are created using simple – and often complex – mathematical calculations. These are mostly classified into leading and lagging indicators. Leading indicators like the Relative Strength Index (RSI) tend to point to the future movement of an asset while lagging indicators use historical data to confirm trends. Examples of the most popular lagging indicators are the Bollinger bands and moving averages.
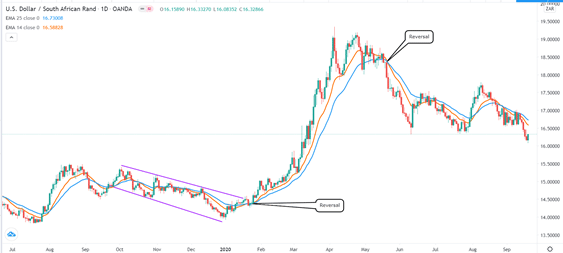
There are several approaches to using technical indicators to identify reversals. A common approach is to use two exponential moving averages (EMA). In this, you identify a currency pair that is trending upwards or downwards and add EMAs with different lengths. A forex reversal happens when the two averages make a crossover.
The chart below shows that the USD/ZAR pair was initially in a downward trend. The bullish reversal happened when the 14-day and 25-day EMAs made a crossover. Similarly, the bearish reversal happened when the two crossed over at the top.
Double EMA approach
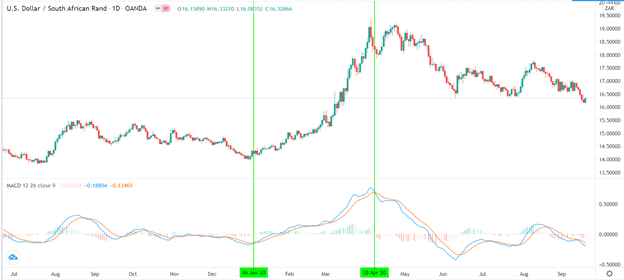
Another approach of trading forex reversal patterns is to use the moving average convergence and divergence (MACD) indicator. This indicator is calculated by subtracting a longer EMA (often 26-day) with the shorter-term EMA (often the 12-day). The result is then smoothed using a 9-day EMA. The MACD has a histogram, and MACD and signal lines. As such, a bullish reversal happens when the signal and MACD lines make a crossover as the histogram moves above the neutral line, as shown below.
MACD reversals example
The main risk of using technical indicators to identify reversals is that at times they can send the wrong signal. This is often known as a false breakout. A popular way to deal with this is to combine more than one indicators such as double EMA and the MACD. Another way is to always look at the volume when the reversal is about to form.
Using chart patterns to trade reversals
Another popular way of trading forex reversals is to use chart patterns. The idea behind this is that you can identify when a reversal is about to happen when you look at patterns. There are several patterns in the market today. Among them are wedges, parallel channel, flags, triangles, rectangles, pitchforks, head and shoulders, and double bottoms and double tops.
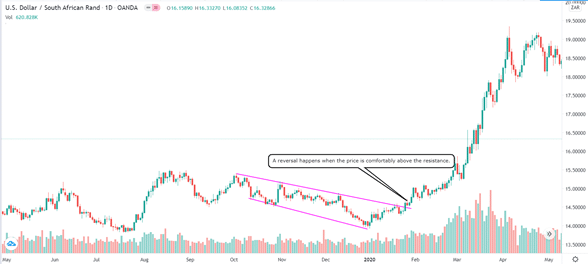
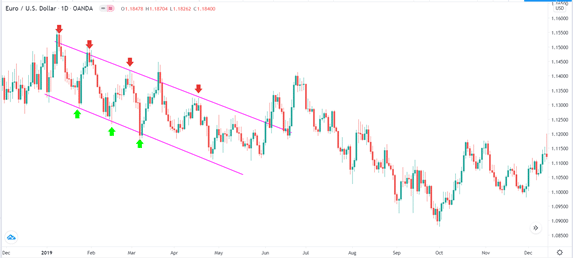
A parallel channel is a good way of using patterns to trade forex reversals. A bullish reversal starts when a currency pair is falling while forming a descending channel. In this case, the reversal will happen when the price moves comfortably above the upper resistance line, as shown in the chart below.
Parallel channel example
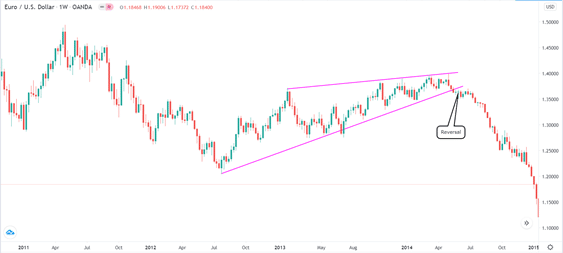
Wedges are also popular reversal patterns. A wedge forms in the midst of a sharp upward or downward trend. Specifically, it happens when a currency pair’s rally starts running out of gas. As it does this, the price tends to form parallel – but narrowing – support and resistance levels. The reversal usually happens when the two lines near the convergence zone. An example of this is in the chart below.
Wedge pattern example
Using candlestick patterns
Candlestick pattern analysis is another popular approach of trading forex reversals. These patterns were first used in the 1600s in Japan, where they were applied in the rice futures market. Today, the same strategies are useful in identifying when a reversal is about to happen.
There are several candlestick patterns, which include the morning and evening star, shooting star, Doji, hammer, and bullish and bearish engulfing patterns. Other popular patterns are the dark cloud cover, three windows, three dark crows, hanging man, and three white soldiers among others. You will find one of these candlestick patterns wherever a reversal happens.
- Bullish engulfing – This reversal pattern happens when, in a downtrend, a small bearish candle is covered fully by a bullish candle. It usually means that the bulls have wrested control over the bears. A bearish engulfing is the exact opposite.
- Hammer – A hammer is a bullish reversal candlestick that forms when there is a small real body and long upper shadow. It happens after a steep decline and is usually an indication that bulls have prevailed.
- Shooting star – This is a bearish reversal pattern that is characterised by a long upper shadow and a small real body.
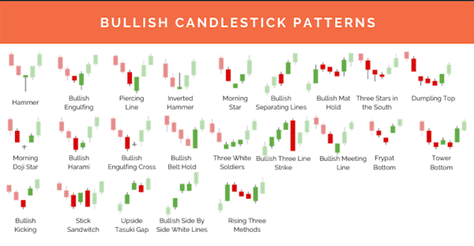
A good way to master candlestick patterns is using a cheat sheet, which is provided by several online platforms.
Candlestick patterns cheat sheet
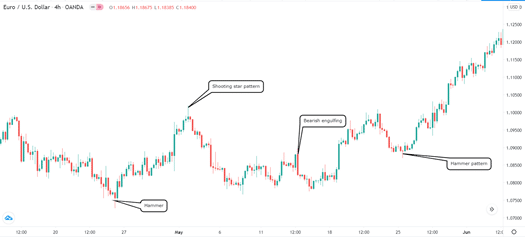
A good example of these candlestick reversal patterns is shown below. In the chart, you can see the hammer, bearish engulfing, and the shooting star pattern.
Candlestick reversal patterns example
Using key support and resistance levels
Another approach to trade forex levels is to use the key support and resistance levels. Ideally, a support is usually viewed as a floor where the currency struggles to move below. A resistance, on the other hand, is a ceiling. In most cases, reversals tend to happen when there is a strong level of resistance and supports.
There are several ways of identifying these support and resistance levels. You can use the Fibonacci retracement tool or even draw pivot points. You can also draw these levels by connecting the high and lower swings as shown below.
Support and resistance example
Final thoughts
Trading reversals is an excellent way of making money in the forex market. When used well, the strategy can outperform other strategies like trend following, which waits for the new trend to form. However, it is also a risky strategy because of the many times that false reversals happen.


