Who would have thought that geometry can help you predict future price movements in a financial market like foreign exchange? Well, welcome to the world of harmonics, a range of geometrical trading patterns which have existed for close to a century.
The beauty of this methodology is its basis on harmonic phenomena. This means that the patterns formed repeat themselves through concrete mathematical ratios, namely those based on the Fibonacci/Fib sequence.
This sequence is very influential because of the so-called ‘golden ratio’ describing the proportions of many things in the natural world, from designs in flower petals, snail shells, tree branches to spiral galaxies, hurricanes, and even the human face.
Of course, Fib also applies to the structure of price movements in virtually all instruments as well. Harmonics can show you highly precise market turning points, often with tighter stops than other strategies and defined profit targets.
In this article, we’ll explore the most common harmonic structures used by forex traders, how to spot them, and the pros and cons of this advanced trading style.
The most popular harmonic patterns
We will now outline the two most commonly-traded harmonics and their structure.
The other frequently referenced patterns, namely the bat, crab, shark, 5.0, and 3-drive, are similar to the Gartley and butterfly except for some differences in the Fib numbers of the legs in price movements.
Gartley
First referenced in ‘Profits in the Stock Market,’ a book released in 1935 and authored by Harold McKinley Gartley, this harmonic is typically the first pattern traders learn.
This is the same book most credit for introducing other harmonics that many other trading analysts improved upon over time. Interestingly, this pattern is also known as the ‘Gartley 222’ or simply the ‘222’ as it’s mentioned on the 222nd page of the book.
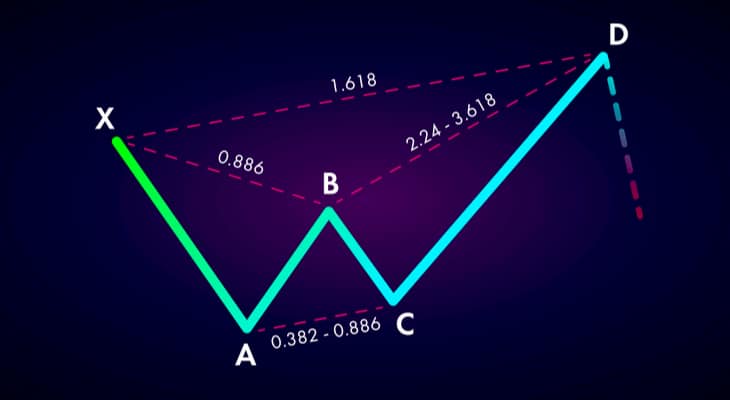
It appears when a market in a recent up/downtrend transitions into a corrective phase, which forms the basis of all harmonics. This pattern comprises five distinct points (XABCD) resembling an awkwardly shaped ‘M’ for the bullish version and ‘W’ for the bearish version.
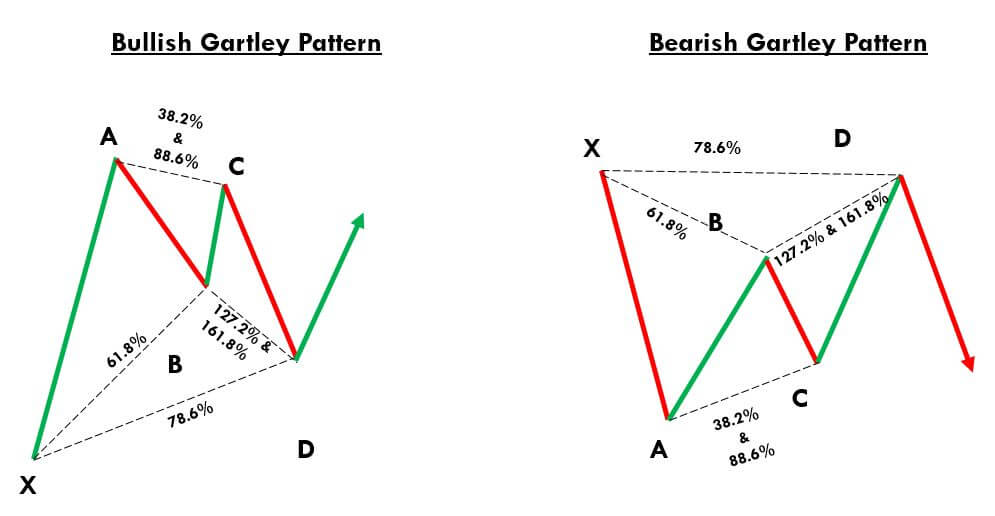
You can use a range of harmonic scanners to identify this pattern on various platforms. However, it’s crucial to know the main Fibonacci retracements forming the pattern:
- XA can start from anywhere
- AB is 61.8% of XA
- BC is between 38.2% to 88.6% of AB
- CD is either 127.2% or 161.8% of BC
- AD is 78.6% of XA
The image below is a recent example of a bullish Gartley on the CHFJPY 4HR chart. The entry point is at D with the stop loss below it (the ATR can help define the number of pips for the stop distance).
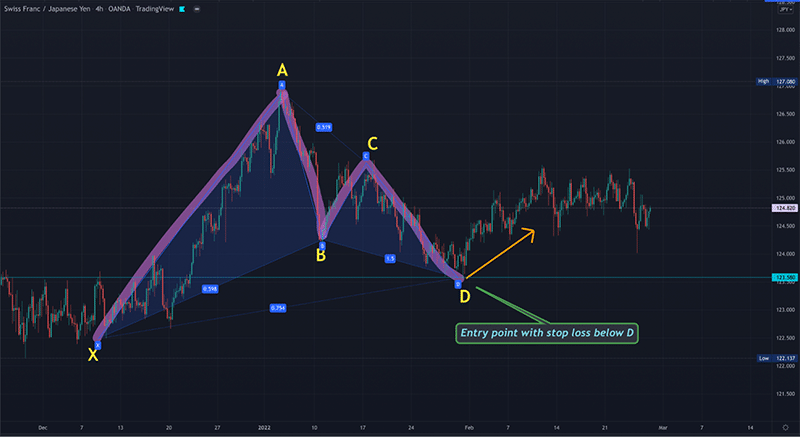
Experienced harmonic practitioners believe the full profit target of this pattern is the 161.8% Fib extension of the AD move (which is just beyond the A point or E). However, there are known ‘mini’ targets along with the move that traders discretionally choose.
Butterfly
The butterfly is near-identical to the Garley as it also consists of a XABCD pattern. However, the main difference is that the CD leg is a lot longer, showing a deeper retracement that goes some pips beyond the X point.
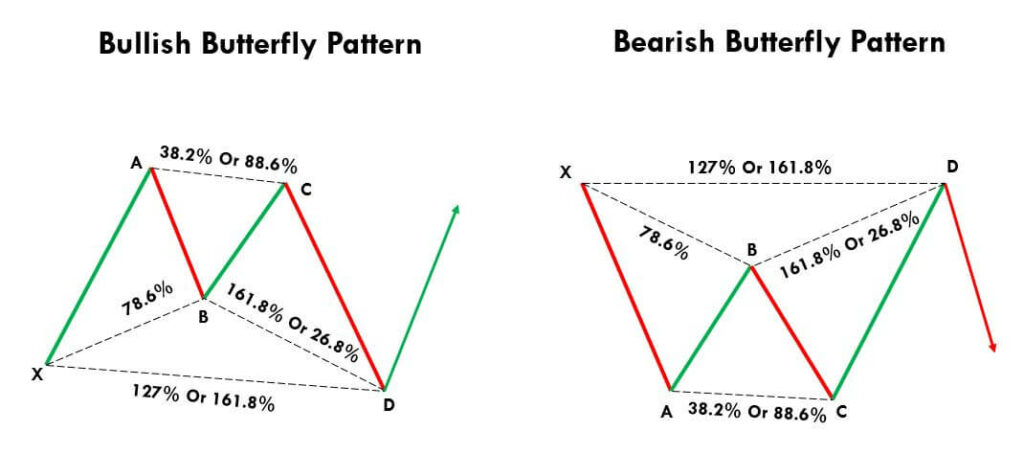
Likewise, the butterfly has exact Fib ratios as so:
- XA can start from anywhere
- AB is 78.6% of XA
- BC is between 38.2% to 88.6% of AB
- CD is between 161.8% to 261.8 extension of AB or between 127.2% to 161.8% of XA
The image below is a recent example of a bearish Gartley on the GBPNZD weekly chart. The entry point is at D with the stop loss above it (again, the ATR can help define the number of pips for the stop distance).
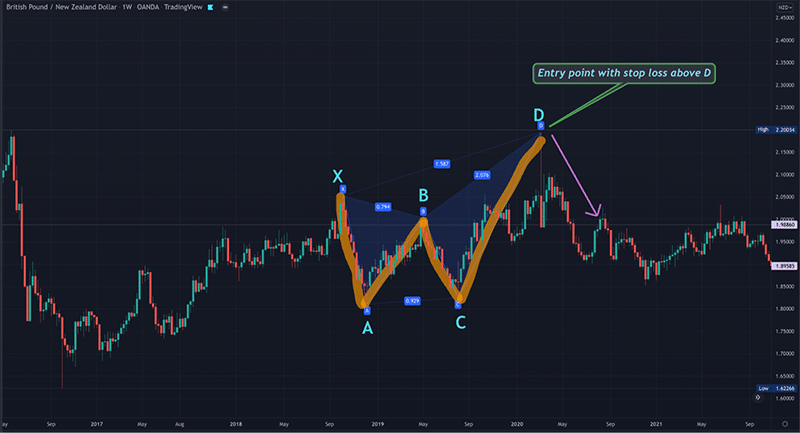
Assuming the market moves a great enough distance, the profit target (E) is above the X point based on a particular Fib ratio. Needless to say, price may not always go this far depending on the time frame, conditions, etc.
Therefore, you should be flexible in your profit-taking approach. Generally, butterfly patterns are harder to identify and appear less frequently, making them more effective.
The best and worst of harmonic trading in forex
Perhaps the greatest benefit is that harmonics offer relatively high risk-to-reward scenarios. Since the turning points are designed to be as accurate as possible, you can usually have a much tighter stop with a larger profit-taking projection.
Finding a well-defined harmonic pattern is rare, making them outstanding and effective. The downsides of harmonic trading are easily understandable; these patterns are challenging and time-consuming to spot, like a needle in a haystack!
Therefore, you must be a really skilled trader with years of experience using the Fibonacci tool. Moreover, you need more patience for the entry by waiting for the entire pattern to form without ‘jumping the gun.’ (although this can also be an advantage)
The second problem is that although harmonics have clearly-defined ratios, entry, and profit-taking points, these can be highly subjective. Every trader may use slightly different rules for identifying certain harmonics, which inevitably produces different results and leads them down a rabbit hole.
The last issue many analysts argue is that virtually all harmonics are reversal patterns. Most traders agree that trading reversals are more complicated than sticking with the trend.
You will generally have a lower win rate, which is another reason why these patterns are best suited for the experienced.
Final thoughts
Of course, as with any other formation, you shouldn’t take a trading signal purely from a harmonic structure. You also need to apply consistent and solid money management.
However, using these patterns with other confirmation factors can lead to favorable but rare profiting opportunities in the markets.


