Most financial markets, like history, have a repetitive and predictable nature. This comes from the mathematical law of large numbers, as the driving forces behind price movements are the market participants themselves. Therefore, traders the world over try to identify familiar price patterns as they manifest and trade them for profit in the hope that they’ll play out as expected. One such pattern is the dead cat bounce, which we shall be looking at extensively in this article.
Defining the dead cat bounce
A story is told of the famous scientist Isaac Newton, on how he came about his discovery of gravity. He was allegedly sitting under an apple tree, perhaps in the shade from the hot sun. Suddenly, an apple fell on his head, and the young genius had an epiphany about the earth’s gravitational force.
Many years later, a similar story – at least in part – was told in regard to the financial markets. It was said that even a cat if it falls from a height, will bounce on reaching the ground. Thanks to gravity, even after the bounce, the cat will continue its plummet to the ground. Applying this to the financial markets, an asset whose price has been on a prolonged downtrend may stage a brief rally, but it will more often than not resume its prior downtrend. This is the dead cat bounce phenomenon.
Identifying a dead cat bounce
Spotting a dead cat bounce boils down to identifying whether a market pullback is a temporary retracement or a reversal of the prevailing trend. To that end, expert analysis is necessary at both the fundamental and technical levels. This analysis helps traders acquire a directional bias while trading. It also helps them determine the level of momentum behind certain price moves, which ultimately helps to discern whether a pullback is sustainable or just temporary.
Therefore, to effectively spot a dead cat bounce, you have to be acutely aware of the current trend and its momentum. You also have to be well informed of the fundamentals that may affect the asset you’re trading, be it a cryptocurrency or currency pair. Technical indicators such as the Fibonacci retracement tool can also come in handy during this stage, as we shall discuss further down the article.
Trading the dead cat bounce
Usually, when prices of an asset plummet, bulls will often be looking for any sign of the beginning of a rally in order to buy the dip. However, such a mentality when trading a dead cat bounce would be grossly misplaced. Therefore, the appropriate response for trading this pattern would be to wait for it to peak, then go short on the asset. But why go short? Because essentially, the cat is still dead. Just because some traders are rushing to buy the dip doesn’t mean you should too. Let’s take a look at a couple of practical examples.
Dead cat bounce in crypto
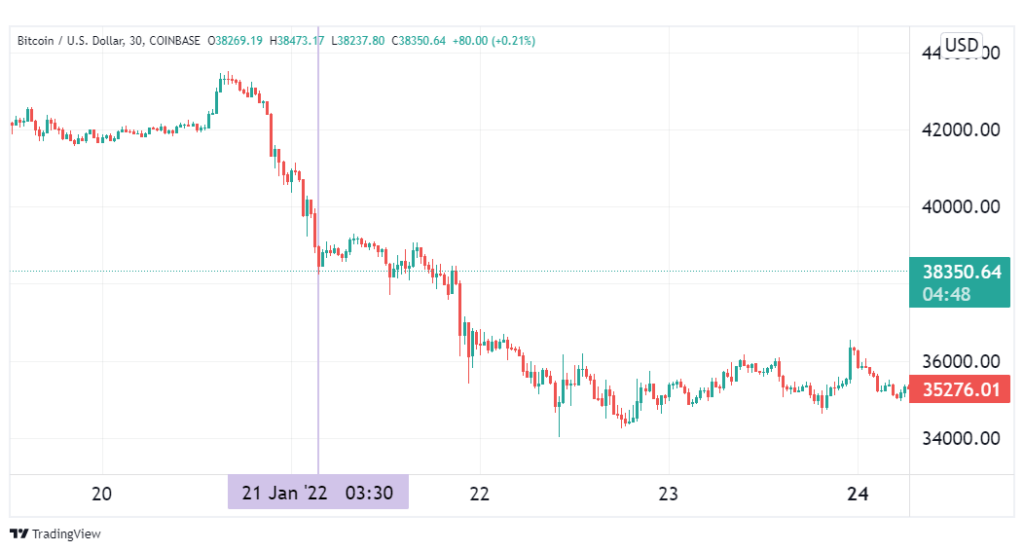
The image above shows the price of Bitcoin plummeting steadily in January of 2022. On the 21st, however, the downtrend stalled as a few traders bought the coin at what they thought was a bargain. However, despite managing to hold off prices from plummeting further for most of the day, the bears soon resumed their dominance.
Notice how the bounce did not result in a significant retracement height. This is because the majority of the market does not believe the uptrend will last; thus, they do not buy into it. This causes the bounce to lose momentum almost as soon as it begins.
Following this observation, we can use the Fibonacci retracement tool to identify potential dead cat bounces. Usually, the levels most watched are the 38.2%, 50%, and 61.2% levels. However, we will be looking for retracements that occur after a prolonged downtrend, but they do not exceed the 38.2% level. These are the most likely to become short-term bounces.
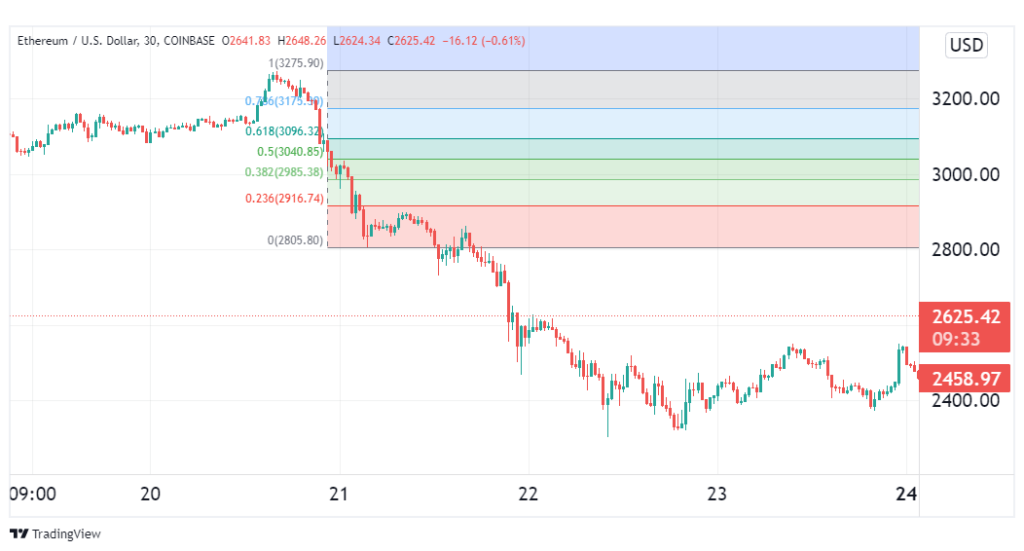
In the illustration above, we see the Ethereum price chart stage a similar bounce. On applying the Fibonacci retracement tool, the pullback nearly hit the 23.6% level, well below the vital 38.2%. To trade such a setup, we would first have to wait for confirmation of the pattern. This occurs when the subsequent price drop after the bounce surpasses the initial swing low. This would be the ideal point to enter our short trade.
For risk management, the appropriate stop-loss should be placed just above the bounce’s swing high. For this trade, this could be at the 23.6% retracement level. The take-profit level should be determined by an appropriate risk to reward ratio, such as 1:2 or higher. By trading shallow dead-cat bounces, we can easily manage a favorable risk-to-reward ratio by employing a tight stop-loss.
Dead cat bounce in forex
The dead cat bounce pattern is not restricted to any particular financial asset. To that end, the aforementioned strategy for trading this pattern can be applied to forex as well as crypto.
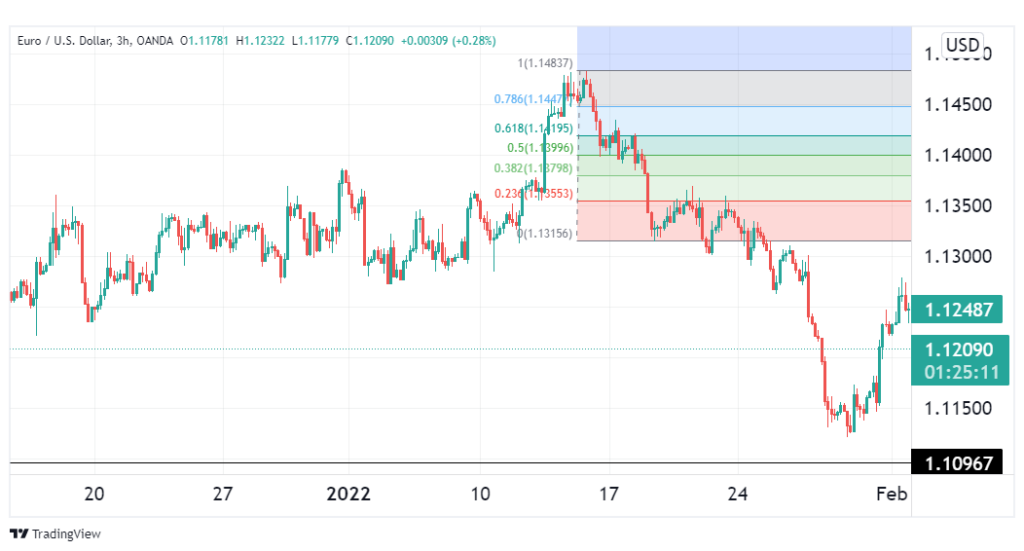
The image above shows the EURUSD in decline in January 2022. After a steady decline, it staged a retracement, which on applying the fib retracement tool appeared to be a shallow dead-cat bounce. To trade this setup, we would wait to go short when the decline after the bounce surpasses the first swing low. A suitable stop-loss would be placed at the 38.2% fib level.
This pair went on to stage a few more bounces before it committed to the decline, but none of them went above our stop loss. For that reason, our trade would still have yielded a profit.
Conclusion
A dead cat bounce refers to a temporary retracement to the upside in the middle of a prolonged downtrend. Usually, the appropriate response would be to wait to short the asset after confirmation of the pattern. A good sign of a tradable pattern is a retracement below the 31.8% Fibonacci retracement level.


