Average Directional Index (ADX) has a unique function. The indicator tells us whether the market is in the range state or the trend state.
The indicator consists of three main parts:
- +DI is the “Directional index” that measures the direction’s consistency when the price grows. If +DI grows, the last candle’s high is higher than the previous one indicating the move up.
- -DI is the same “Directional index,” but the one that shows the direction’s consistency when the price declines.
- ADX finds a ratio of +DI and -DI in such a way to show the consistency of the price moving in a single direction or how stable the trend is.
When ADX is above 25, the market is trending. As the higher the value of ADX is, the stronger is a trend. When ADX is below 25, the market enters a range state. The default period of the indicator is 14.
The “engineering” beginnings of ADX
J. Welles Wilder Jr. developed the ADX indicator in 1978. Wilder is also famous for creating other core indicators like ATR, RSI, and Parabolic SAR. If you read his book New Concepts in Technical Trading Systems, which he published in 1978, you will soon notice his tendency to describe his views on the market concepts mathematically. Wilder started his career as a mechanical engineer, no wonder why in the 70s, he could see the markets from such a mathematical perspective, while fundamental analysis was a dominant analytical approach at that time.
Wilder based ADX, and other indicators on elegant mathematical formulas, that make sense in the real market conditions. Almost in every formula, Wilder uses the close prices of the day. As he traded commodity futures, day’s close prices were essential in the futures market.
We’re all humans or how ADX keeps a trader’s judgment clear
Many trading systems are potentially profitable. The problem is that their profitability doesn’t last. The biggest hurdle for any trading approach is the ability to adapt to the changing market conditions.
Experienced discretional traders know when not to trade to preserve the capital. They often look at the price action directly, without any aids, like technical indicators, and recognize the kind of a market state they are in.
Why would we need any indicators, if we can get the information we need, just by looking at the price action?
Think of a pilot operating an airplane. Modern airplanes get more automated. Sophisticated equipment helps to eliminate human error. The pilot’s natural senses can let him down, during unfavorable weather, for example.
In the same way, even highly-experienced traders can make poor decisions simply due to fatigue, emotions, and other human factors.
Identifying a market state is a complex task that requires the right state of mind, experience, and the ability to see a big picture.
Entry signals can be pretty obvious, and easily executable regardless of a mental state. For instance, if you see the price crossed above the Moving Average, there is no confusion about whether to buy or not. If it’s one of the buy-rules in your trading system, there is not much to think. However, the decision of whether to trade at all encompasses more variables. Hence a trader is more prone to mistakes. Look at the chart below. Do you think it’s a range or a trending market?
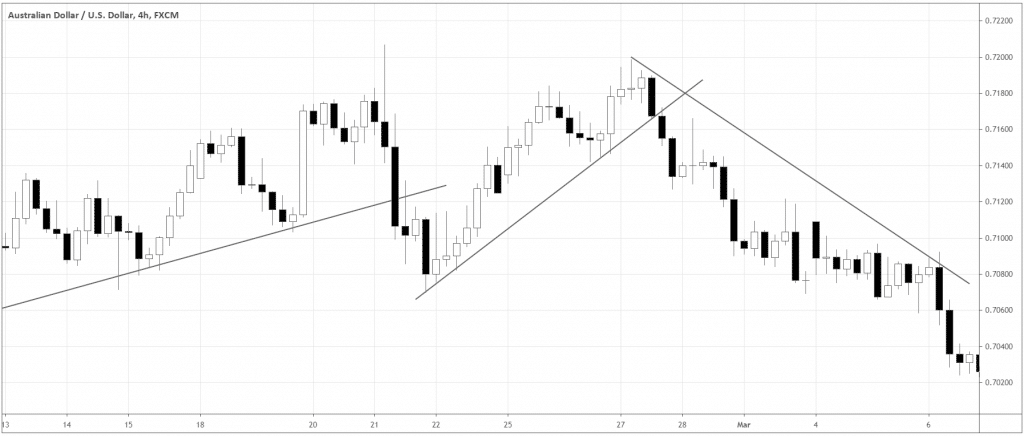
I put three trendlines to mark the moves that traders might interpret as a “trend”. Now let’s see what ADX tells us about the whole thing:
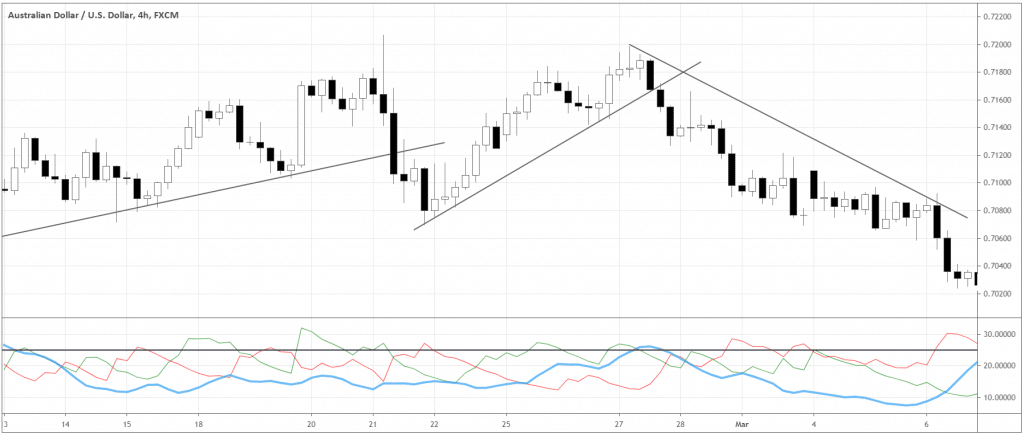
ADX (the blue line of the indicator) stayed below 25 for almost the entire analyzed period, signaling the range market.
As you see, sometimes it’s not so obvious whether the market is trending or not. ADX makes it clear from the machine’s “pilot’s device” perspective. If you see a setup that you like, but you hesitate due to the market’s context, ADX can be a crucial factor in your final decision.
Although non-directional, ADX still offers entries
Contrary to the popular description, ADX can generate entry signals independently, without the need to include other technical indicators.
The following conditions will apply if ADX is above 25. Therefore, the market is trending.
- If DI- crosses above DI+, it signals the start of a downtrend. Traders can short-sell the market.
- If DI+ crosses above DI-, the uptrend is starting. Traders can go long.
Here are examples of these kinds of entries.
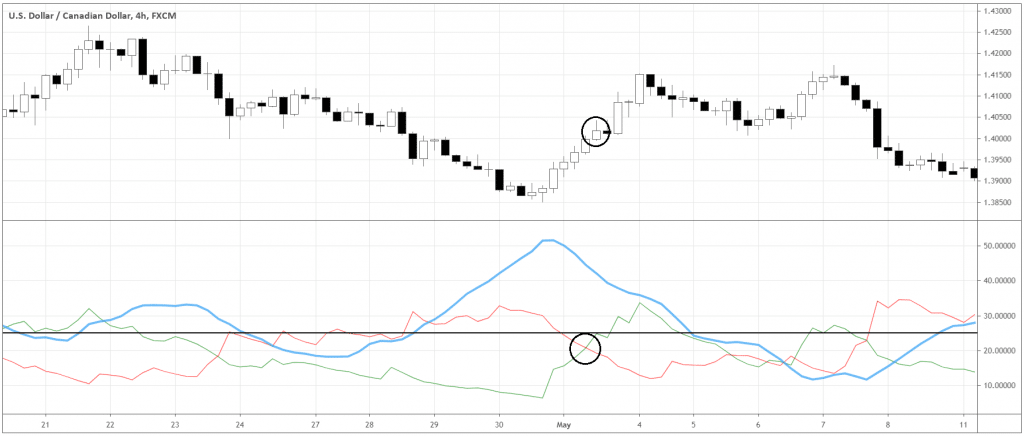
As you see, those are reversal entries. In general, reversal setups are riskier than trend continuation setups. To spot the setups towards the trend, you will need to employ other market analysis methods, – price action, for example.
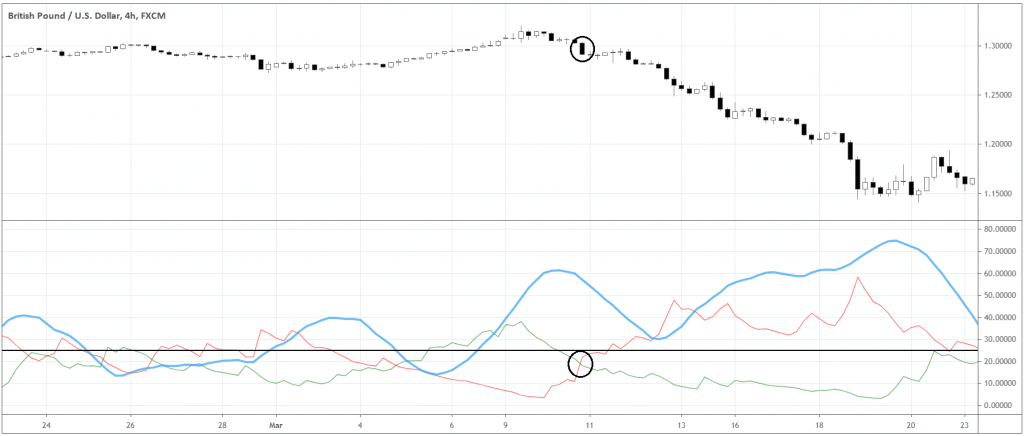
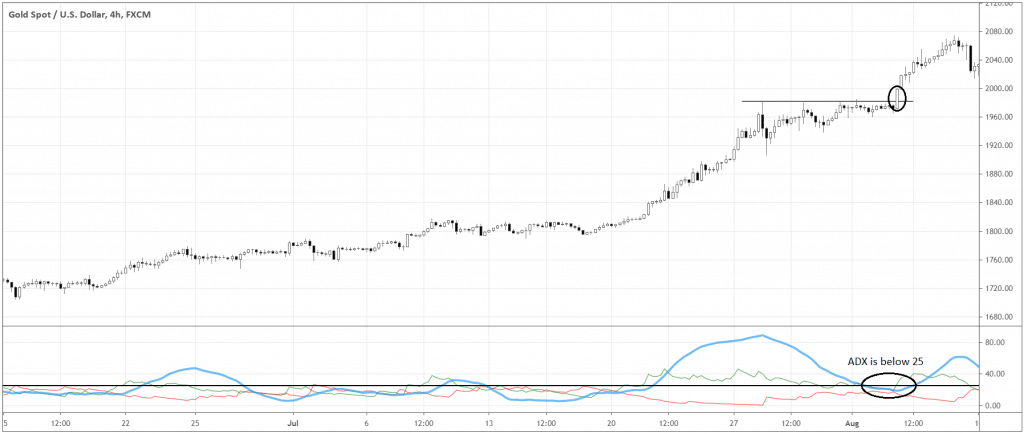
Like all technical indicators, ADX is a lagging indicator as it only calculates the past data. Sometimes, there are cases when you need to follow the common sense to identify the market’s state.
Below is a trending market. You will say it’s a trend even looking at it from afar. For me, the circled breakout is a high-quality trend continuation signal. However, ADX still showed that it’s a range. That’s why we should always look at the price action first and then at what the indicator shows.
Measure the trend momentum with ADX
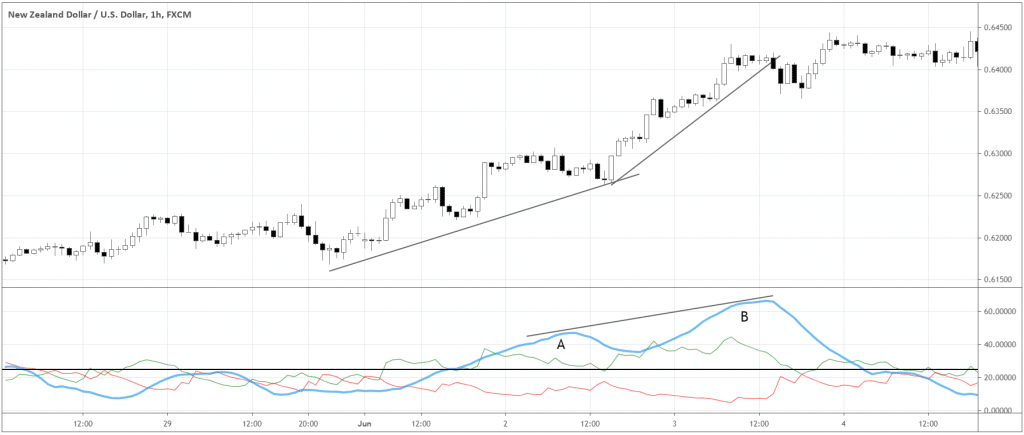
ADX can also help us to see if the trend momentum changes. When the peaks of the ADX line get higher, the momentum increases. Conversely, when the peaks get lower, the momentum is fading. We can use this information to manage our trades more effectively. For example, adjust the trailing stops.
Look at the example of the momentum change in the chart below. In the indicator window, the swing “B” is higher than the swing “A” without ADX ever declining below 25. Notice how the slope of the trend gets steeper as the momentum grows.
ADX identifies the state of the market we are in. Readings of the indicator help traders to decide on what strategy to use or whether to trade at all. ADX is based on the logical principles using close prices and the differences between the candles’ extremums to quantify the prices’ expansion level. ADX can also offer some reversal entry opportunities independently from any other indicators. Traders must always keep in mind the lagging nature of the indicator and look at the signals from ADX in the context of the current price action.


