
The Elliot wave theory was developed by Ralph Elliot, a well-known German accountant and author, who spent years studying the financial market. He concluded that financial assets like stocks and indices tended to move in a series of waves, which are today known as Elliot waves. In this report, we will look at what the Elliot wave states, how to identify it, and the rules that govern the theory.
What is the Elliot wave theory?
According to Ralph Elliot, a financial asset whose price is rising or falling does so in a series of five waves. In an uptrend, the three waves are usually bullish while two waves are usually bearish or corrective. Similarly, in a downward trend, three waves are usually bearish and two of them are bullish. The chart below provides a simple illustration of a bullish Elliot wave chart.
How Elliot wave looks like
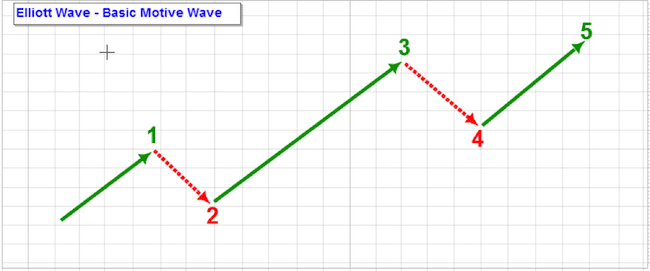
The reasoning behind the Eliot wave is relatively simple. The first wave happens when the price of an asset starts rising. In this period, the market is not all that focused on the price. After reaching a certain point, some buyers start to exit, which leads to the first pullback. As the price drops, some original and new buyers spot the opportunity and buy the asset. At this stage, the market is convinced of the rally and more buyers come back in.
The fourth wave, which is usually corrective happens as some buyers exit and take profit. After making a small decline, some buyers return and push the price higher. The same approach usually happens when the price of an asset is falling, as shown in the chart below.
Elliot wave live chart
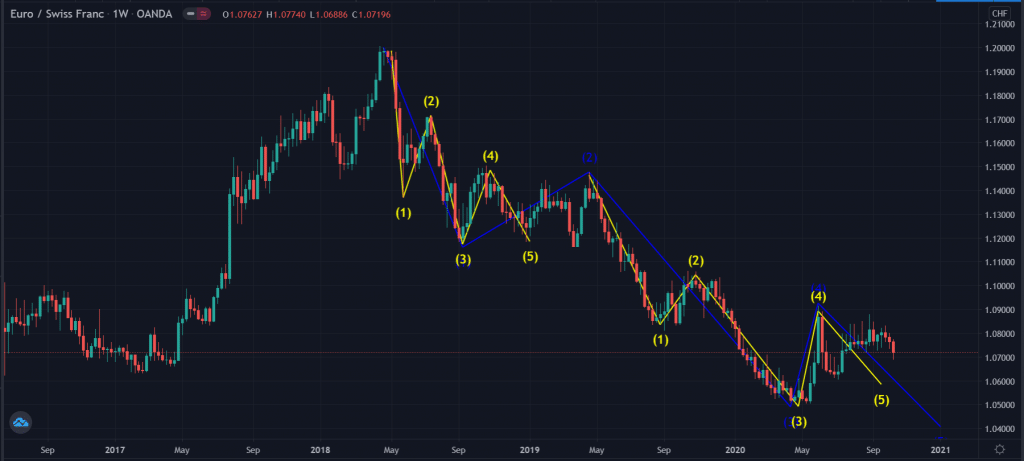
In this chart, the main Elliot wave is shown in blue. As you can see, a common rule in Elliot Wave is that several waves tend to form during the overall wave formation.
Rules of an Elliot wave
For an Elliot wave to form, Ralph Elliot identified three main rules to guide its application. Fortunately, these rules are usually relatively easy to see.
- Wave 2 – A key rule is that the second wave should never retrace the third wave completely. This means that the tip of the second wave should always be above the origin of the first wave.
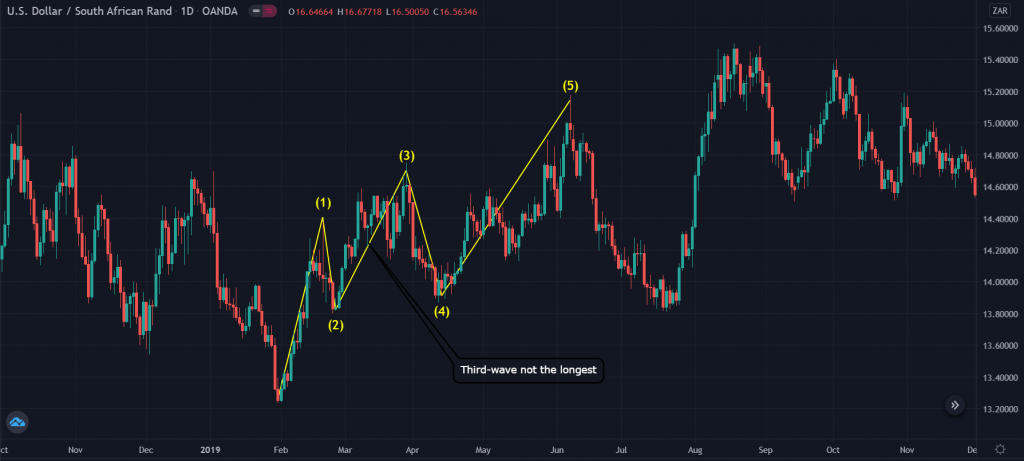
- Wave 3 – The rule that guides the third wave is that it is never the shortest of the five waves. This is because, as explained above, the number of participants in the direction of the wave is usually higher.
- Wave 4 – Like the second wave, this wave never retraces 100% of the third wave.
If one of these rules is broken, the Elliot wave pattern is invalidated. For example, in the chart below, the Elliot wave is invalidated because the third wave is not the longest.
How to invalidate the Elliot wave
There are other unwritten rules in the Elliot wave. For example, as mentioned, in a longer-term Elliot wave, there are usually several smaller waves. Another unwritten rule is about where the first wave starts. Ideally, the first wave starts at a point where the price has formed a solid bottom or top.
How to draw Elliot wave in forex trading
The process of drawing an Elliot wave in forex is relatively easy now that you have a good understanding of what it is and the rules that guide it. It is worth noting that a complete Elliot wave pattern takes time ranging from a day to years. For example, the first EUR/CHF example showed above started in May 2020 and is continuing to date. Therefore, it is not an ideal trading approach for day traders and scalpers, who have a very small horizon in the market.
The first step of drawing the Elliot wave pattern is to visually scan the market to find unique chart patterns. For example, it is almost impossible to use the waves in a ranging market. The most ideal point to start the Elliot wave is usually after a currency pair or any other asset finds a definitive bottom or top. In several periods, it is usually at a time when it has just formed a double bottom pattern.
After identifying a good starting point, a good approach is to use the Fibonacci retracement tool to predict where the first wave will end at. For starters, the retracement is derived from the Japanese mathematical concept of Fibonacci sequence. Ideally, this pattern is drawn by connecting significant highs and lows, as you can see in the example below.
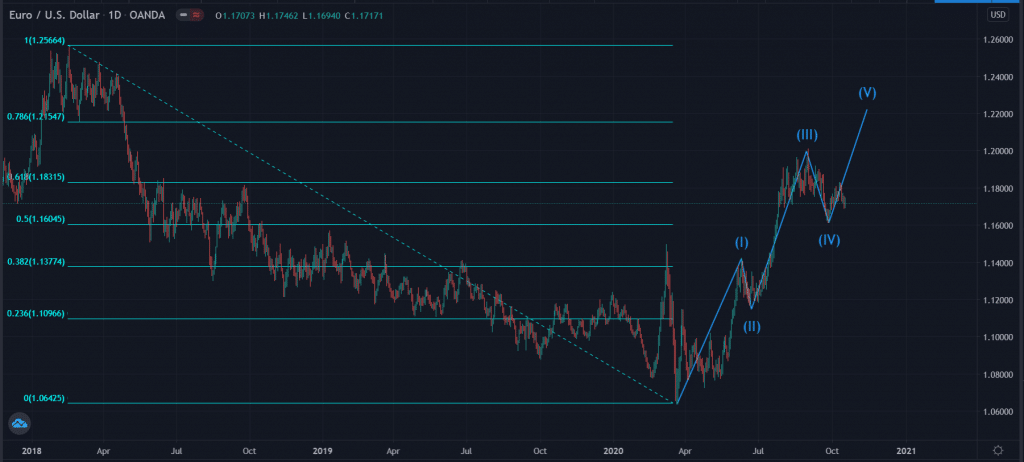
In most cases, the first wave will go up to the 38.2% Fibonacci retracement level. The second corrective wave tends to end at or slightly above the 23.6% retracement level while the third wave runs above the 61.8% retracement.
In the example below, we see that the EUR/USD pair was previously in a strong downward trend starting from February, 2018. It then bottomed in March, 2020. Therefore, we have drawn the Fibonacci by connecting the two points.
The first wave starts at this low point, moves to the 38.2% retracement, falls back to slightly above the 23.6%, and then rises above the 61.8%. The fourth wave ended at the 50% retracement, and the price is now in its fifth wave.
Example of Elliot wave (daily chart)
How to use Elliot wave in forex
Now that you know how to draw the Elliot wave, how do you use it in the market? A good option is to first identify the wave in a longer-dated chart like the daily one above and mark the specific points on the Elliot wave. After this, you should go back to the shorter timeframes and use the marked points as support and resistance points.
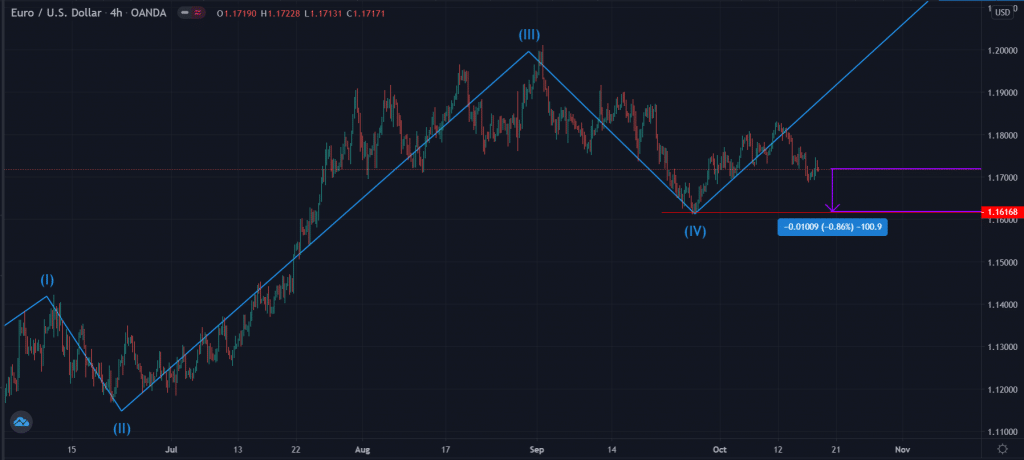
For example, using the EUR/USD pair, you know that the pair is in the fourth wave. So, you can narrow it back to the four-hour chart, with the lower side of the Elliot wave as the support. Therefore, you can place a buy limit trade at 1.1616. This will initiate a new buy order and ride the fifth wave.
Example of how to use Elliot wave
Conclusion
The Elliot wave is a relatively popular approach to trade the forex market. To use it well, you need to know how to identify the starting point and how to apply the three rules. Also, you need to know how to incorporate other strategies like the use of Fibonacci retracement tools. However, if you are a beginner, we recommend that you spend a considerable amount of time learning and practicing it before you use it in a live account.


