
In the Forex market, trend indicators work in both bearish and bullish markets as traders can benefit from both types of markets. Quite naturally there are many trend indicators that have been used extensively by traders around the world. It should be noted that these strategies using trend indicators only work in markets with trends.
Bollinger Bands:
The Bollinger bands indicator is regarded as one of the most famous trend indicators used by traders, especially by retail traders. The inventor, John Bollinger, had two uses for it when he developed the indicator: To measure the market’s volatility and to show trending conditions.
Bollinger Bands consist of three bands that closely follow the price, with a band in the middle being a moving average such as the EMA. The bands follow the price and reflect the volatility as well. Volatility is said to be going lower as the bands get closer, signalling that a breakout is imminent.
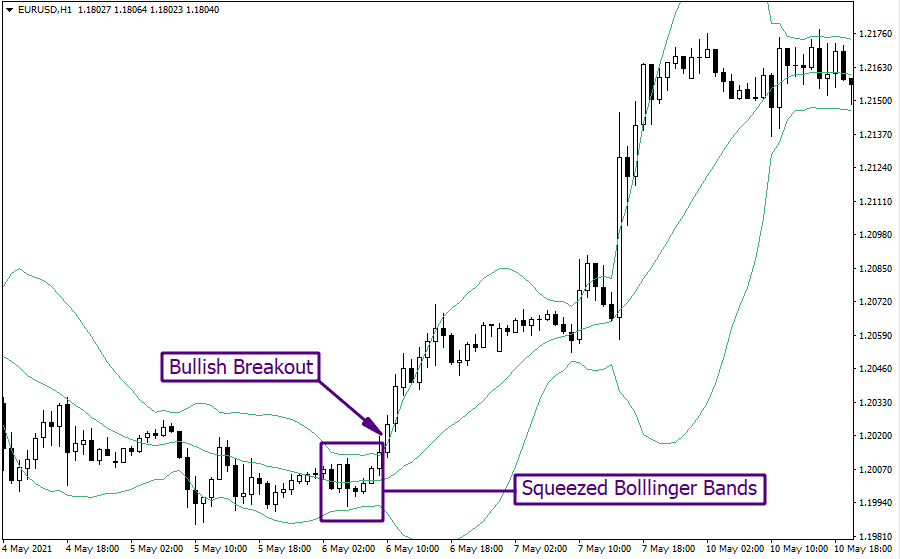
As we can see in the above image, EURUSD was initially moving in a sideline direction. At the same time, the Bollinger Bands were eventually getting closer to each other following the low volatility of the price. Next, the price broke the higher band of the indicator and initiated a bullish breakout of the price.
Besides breakouts, Bollinger Bands can also be used to spot trend-following trading opportunities. In such a case, we’ll need to closely observe how the price reacts when it tests the higher and lower bands of the indicator.
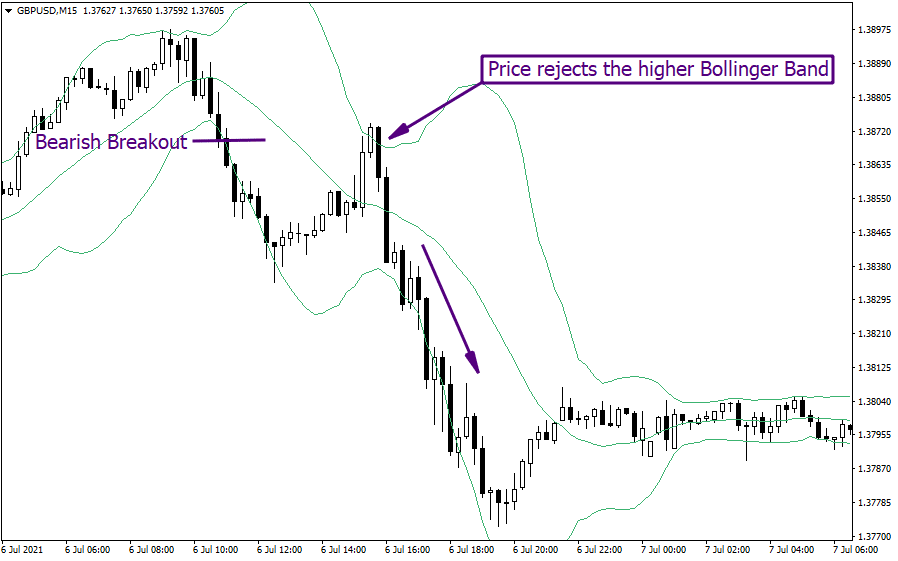
According to the example above, the price plotted a bearish breakout at the lower band of the indicator and initiated a bearish market trend. Next, the price pulled back to the higher band (oversold area), made a false break at the respective level, and reversed back downwards to rejoin the bearish trend.
ADX or Average Directional Movement Index:
The ADX trend indicator is used to measure the strength of a trend, a key piece of information to almost all traders. During strong bullish conditions, traders may decide on skip selling at resistance, hoping that the price might go through it if the trend is strong. However, buying into support may not be wise for a trader during strong bearish trends.
In such a situation, traders can get confidence in choosing what action to take if they know the strength of a trend. They may skip the trade when the trend doesn’t confirm a trade, even though all other things point towards it. The ADX usually shows a value between 0 and 100. When above 40, trend indicators may provide the right entry for a trade. When below 20, it is indicative of weak trading conditions.
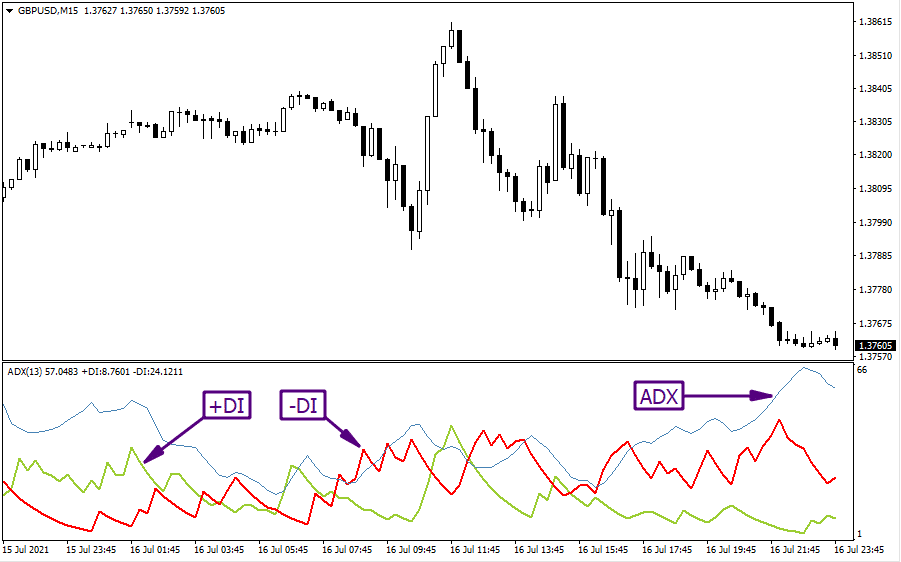
The ADX value determines the strength/weakness of the price in the same manner for both bullish and bearish trend conditions. For instance, the ADX value rising over 50 during a bearish move of the price means the market is in a strong downtrend.
Moreover, this indicator also demonstrates the Directional Index (DI) of the price that provides further confirmation of the market trend direction. The +DI represents the strength of a bullish trend, and the -DI shows the strength of a bearish trend. For example, the +DI above -DI indicates the price is moving in an absolutely bullish trend.
Parabolic SAR:
Developed by Wilder in the 1980s, the Parabolic SAR is a popular trend-following indicator. Like many other indicators, the Parabolic SAR also lags the price action. However, during strong trends, its stop and reverse functions are helpful in notifying traders that a new trend is clearly in place.
The Parabolic SAR can calculate future values based on historical ones. Traders also use it to set an appropriate stop loss in a trade. As the Parabolic SAR remains on the chart after signalling a bearish or bullish condition, traders use this as an invalidation of the previous trend. They thus use it to trade short-term as the market rarely forms strong trends.
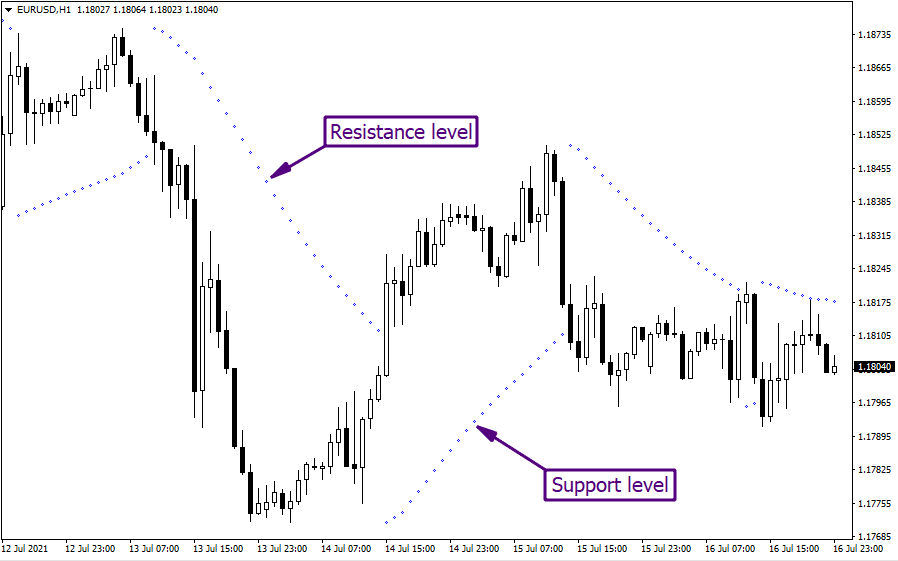
The signal dots appear below the current price candle’s low indicates the market trend is bullish. During a bullish trend, the Parabolic SAR level works as trendline support. Once the support is broken, the signal dot automatically switches its position to the price candle’s high confirming a bearish trend reversal signal.
The trendline support/resistance outlined by the indicator is dynamic, and its progression vastly depends on the price volatility levels. The distance between the price and signal dots increases, meaning the market is highly volatile and in a strong trend direction. On the other hand, the price closing into the indicator level implies the market is in a sideline situation, and the volatility is extremely low. We’ll prepare for a possible price breakout for determining a fresh trend direction in such a scenario.
Moving Average:
The 200 period Moving Average or the MA(200) is considered as the “mother of all moving averages”. There are multiple ways for a trader to deal with trends when using the MA(200). Traders can buy dips in a bullish trend or sell spikes in a bearish trend. Traders can also interpret multiple moving averages or various periods and look for their perfect order from fastest to slowest.
Additionally, traders can sell spikes after a death cross between MA(200) and the MA(50) and buy dips after a golden cross.
According to the generally accepted rules, the MA 50 moving above MA 200 represents a bullish crossover of the moving averages. Conversely, the MA 200 turning above MA 50 is considered as a bearish crossover signal. Besides crossover signals, these MAs also indicate intraday and long-term dynamic support/resistance levels.
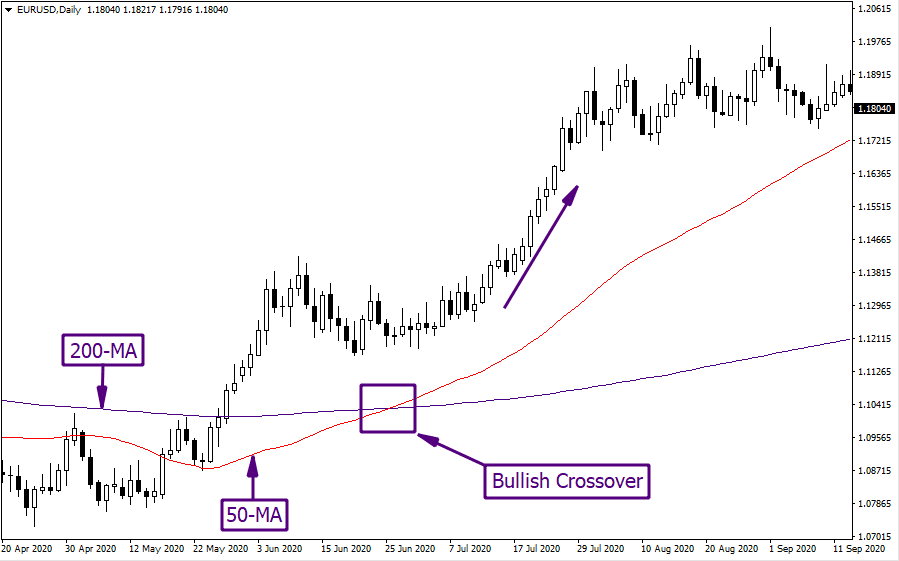
As you can see in the above image, after the 50-MA moves above the 200-MA, the price initiates a strong bullish surge to the north following the bullish crossover signal. Here, we’ve applied only the simple moving averages. If you wish to focus more on the recent changes in price-actions, you may switch to an exponential moving average (EMA).
Moving Average Convergence Divergence:
The Moving Average Convergence Divergence or MACD has a strong trending component, even though it is listed as an oscillator on most trading platforms. The MACD consists of a histogram that can show the nature of any current trend in the market, making it one of the most powerful trending tools. Traders should use the histogram against the MACD line. The histogram tends to stay below the MACD line in a bullish trend. Thus traders should exit when the histogram crosses above the MACD as it may indicate a possible bullish reversal.
MACD line in a bullish trend. Thus traders should exit when the histogram crosses above the MACD as it may indicate a possible bullish reversal.
One simple technique to assess the trend direction using the MACD is to follow the positivity/negativity of the indicator’s value. During a strong bullish trend condition, both the MACD line and its histogram bars will show positive values. Once they drop below zero levels, consider it as a bearish reversal of the market trend.
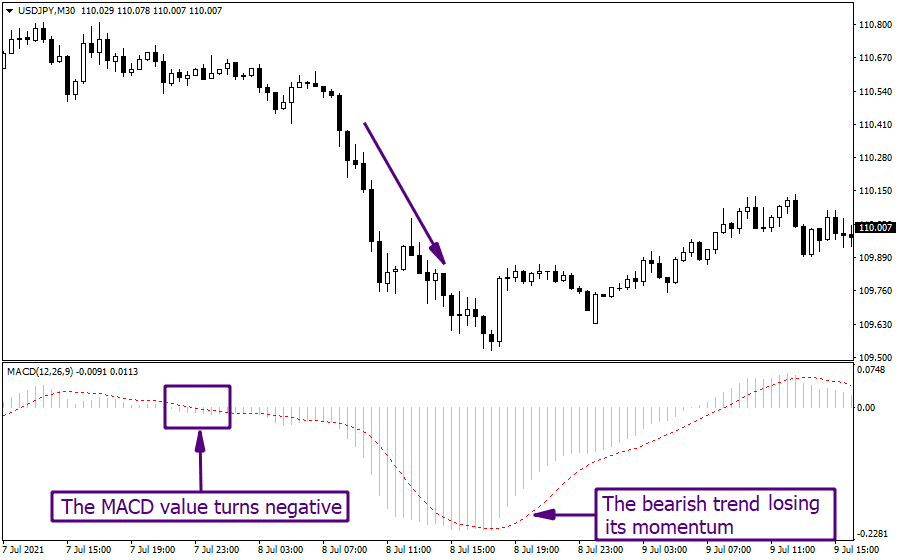
According to the above image, the price initiates a bearish trend move after both the MACD line and the histogram bars drop below 0. The price keeps moving downwards strongly until the histogram bars start to close above the MACD line showing the current bearish trend is losing its momentum.
The Aroon Indicator:
The Aroon Indicator is one of the lesser-known but powerful trend indicators in existence. Built by Tushar Chande in 1995, it is mainly used for identifying changes in the underlying trend. It is unlike other trend indicators It consists of two lines and appears at the bottom of a chart. It works only on the daily timeframe.
The Aroon indicator measures the changes and the strength of any trend in a separate window like an oscillator. Traders can use it as a confirmation to a trend’s strength. The two lines the Aroon indicator is made up of are conveniently named Aroon up and Aroon down. The market is said to be in a bullish trend when “Aroon up” crosses above the “Aroon down” line. A bearish trend begins when the reverse happens.
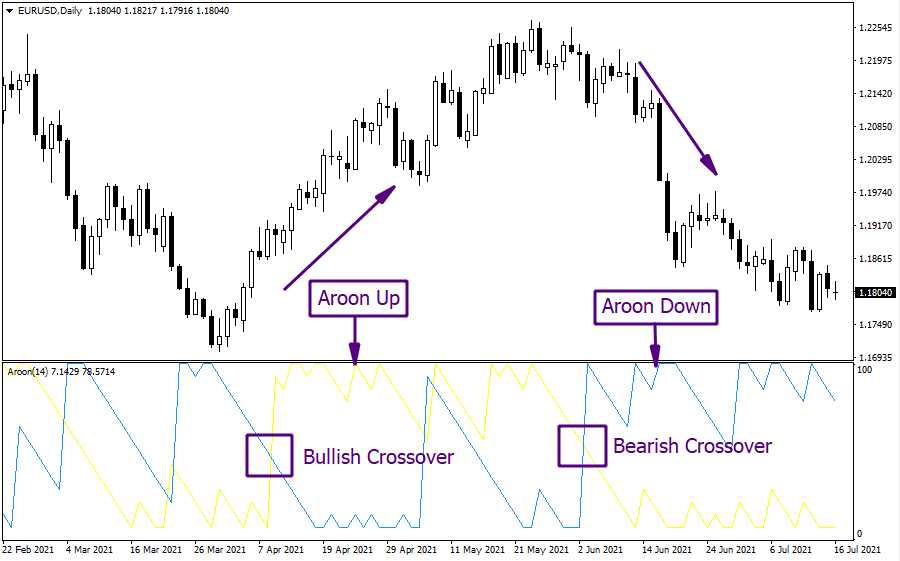
In the above chart example, we’ve applied a 14-period Aroon indicator. The line in yellow color shows the Aroon Up and the line in blue represents the Aroon Down. Initially, the Aroon Up moves above Aroon Down and plots a bullish crossover. We consider it as a buy signal. As you can see, right after the crossover was plotted, the price starts to hike north and makes a large bullish move. Once the bullish move was slowed down by a sidelined condition of the market, the Arun Down moved above Aroon Up and formed a bearish crossover signal. In the meantime, the price also made a bearish breakout and ended the sidelined period by initiating a strong bearish trend.
Donchian Channel:
The Donchian Channel is considered a unique channel that reinforces trending conditions. Developed by Richard Donchian, it is a trend indicator that helps users identify trends. Trading with the Donchian Channel can be both simple as well as complex. It is generally advisable for traders to sell when the price reaches the lower edge of the channel, and buy when it reaches the upper edge.
However, the major drawback of this indicator is that it wasn’t originally developed for the currency market.
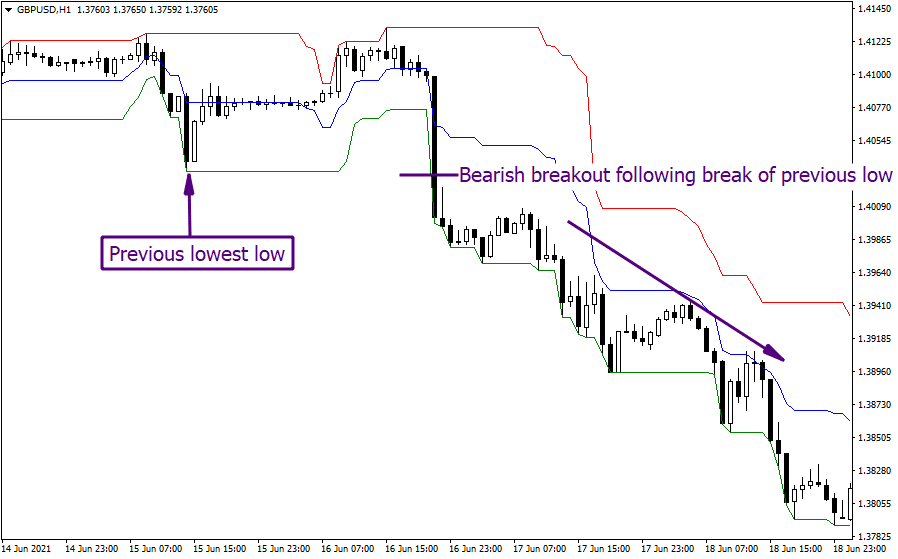
The upper band and lower band of the indicator are plotted based on the previous highest high and the lowest low of the price. Whenever the price breaks such significant peaks and bottoms of the previous price range, we consider it as a price breakout.
According to the above example, the red line at the top shows the previous market high, and the line at the bottom shows the previous market low. As you can see, once the price breaks the lower band of the indicator, a bearish breakout is confirmed, and the market initiates a bearish trend move.
Conclusion
Trend indicators gained popularity with the emergence and expansion of online trading which provided traders around the world, access to technical market indicators. Thus, they have been applied to any given chat by almost all online traders.
However, it should also be known that most of the above indicators were developed before the emergence of trading in the currency market, as we know it today. Almost all technical indicators lag in price action. This is quite a challenge for traders to smooth the price action in a way to allow the trend indicator to reflect accurate changes in price.
For instance, Bollinger bands tend to work best if the traders using the middle Bollinger band, also uses an EMA instead of the implied Simple moving average. Thus, even though trend indicators lag in price action, it can help traders ride important trends. Traders can make up for previous mistakes that have affected their trading account, by riding a trend on the daily timeframe
Last updated: July 29, 2021


