
The price of a financial asset, such as a currency pair, is critical to trading because the price change determines whether a trader makes a profit or loses money. Traders who focus on price action must employ price patterns, which entail analyzing moving waves to determine when to enter or close a position. The cup and handle pattern is a traditional pricing pattern used by traders. When this pattern develops, it piques the curiosity of experienced traders.
Definition
The cup and handle is a bullish continuation pattern that gives buy signals. It appears during an uptrend and denotes a period of consolidation followed by a breakout. The cup denotes a price trend pause, whereas a breakout on the handle denotes trend continuation. In an uptrend, price declines for a period before rising again to the same level, forming the cup. The handle is formed by pulling back or moving in a channel.
Properties
Cup
The Cup is typically U-shaped and has a curving bottom with nearly equal highs on both sides. A “V” shaped cup qualifies as a Cup and Handle pattern, although the conviction is higher in the U shape due to the bottom consolidation.
Handle
The retreat from the higher end of the cup, which may be rounded, triangular, or descending channel, is generally the handle. The reversal is usually approximately a third of the size of the previous surge. The smaller the retreat, the stronger the structure and the greater the chance of a breakout. Increased volume should accompany the breakthrough from the handle’s resistance.
Period
The cup normally forms over a period of 1-6 months, or even longer. Depending on the time duration of the cup, the handle should form over a period of 1-4 weeks or even longer.
Entering the trade
Ensure that the handle is formed before entering the trade. A sideways or descending channel, or a triangle, is frequently used as the handle. When the price rises over the top of the channel or triangle, it’s time to buy. The pattern is deemed complete when the price goes out of the handle, and the price is projected to rise.
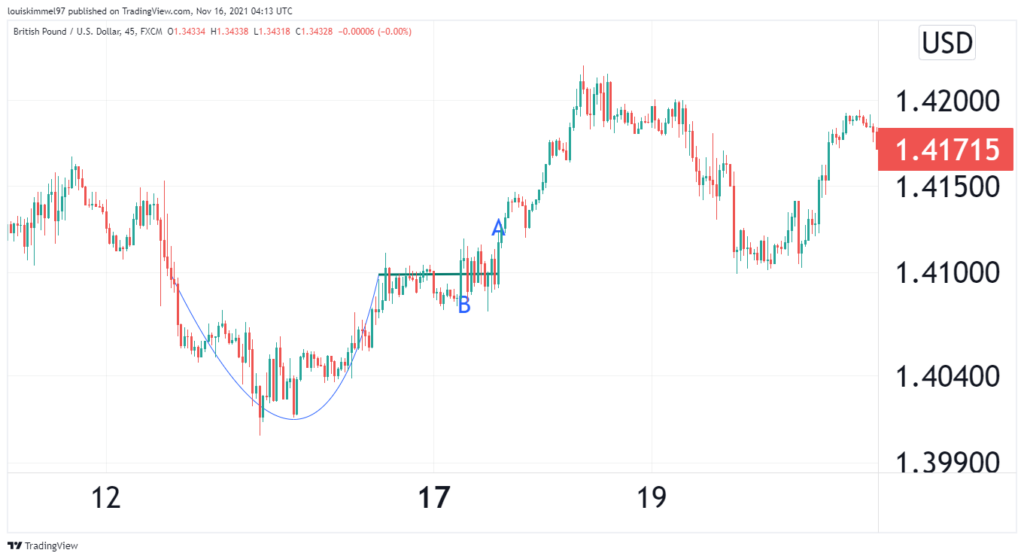
In the GBPUSD chart above, enter the trade at the point marked A, which is at 1.41234. Here, the handle is confirmed, and the price has risen above the handle, confirming an uptrend.
While it is expected that the price would increase, this does not guarantee that it will. The price could increase briefly before falling, continue sideways, or drop immediately after entry. As a result, a stop-loss is required.
Setting a stop-loss
A trader can use a stop-loss order to pull out of a trade if the price lowers instead of rising. The stop-loss function is to limit the trade’s risk by selling the position if the price falls too far to distort the setup. Set a stop-loss order below the handle’s lowest position.
In the GBPUSD chart above, a good spot for the stop-loss is at the point marked B, which is at 1.40828. It is the handle’s low. In case of a reversal, the stop loss would be ideal and the losses minimized.
A stop-loss could also be placed below the most recent swing low if the price oscillated up and down several times within the handle. A properly positioned stop-loss should not end up in the lower half of the cup formation since the handle must occur within the upper half of the cup.
Choosing a target
One of the ways you can determine the target, or take profit, is by adding the height of the cup and the handle’s breakout point. The sum is then added upwards to get the target point. The left side of the cup is occasionally taller than the right. For a closer target, use the smaller height and add it to the breakout point. Alternatively, use the higher height if you expect the asset to move further.
In the GBPUSD chart above, the height of the cup and handle’s breakout point is 99.2 at 1.41190. The target should be the same height upwards, which is 1.42146.
The other way you can set the target is to employ a Fibonacci indicator. Draw the Fib from the low of the cup to the high of the cup on the right, then link it to the low of the handle. A conservative target is at 100%, while a very aggressive price target is 1.618%.
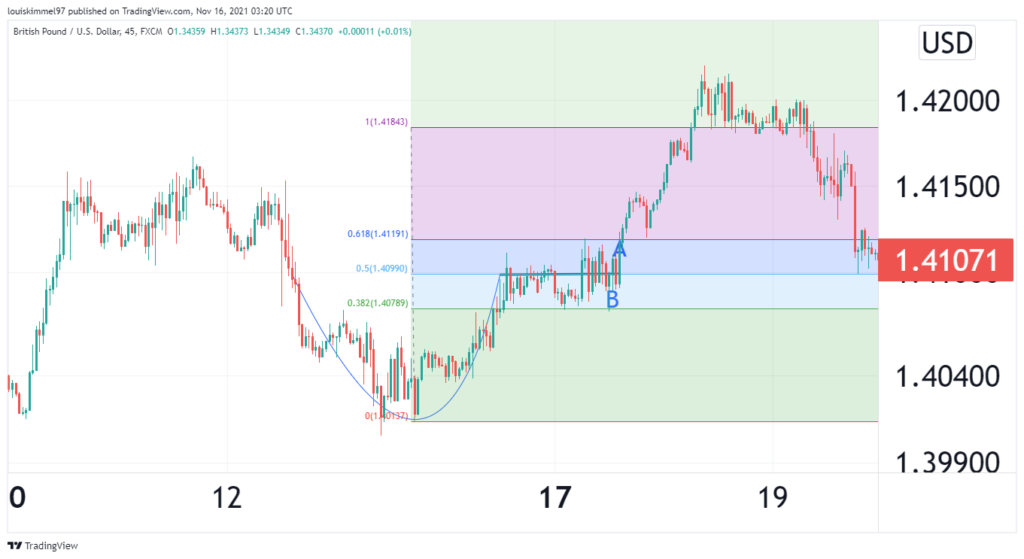
GBPUSD illustration above shows that when you apply the Fibonacci tool, you can set the target at 1 Fib retracement level, which is at 1.41825.
Limitations of cup and handle pattern
- It doesn’t happen at a precise time. The pattern could emerge in days, weeks, or months, and there are no hard and fast rules about how long it will take to emerge.
- False signals, often known as “False Cups and Handles,” can provide traders with inaccurate information.
- Even if the pattern, in theory, suggests so, it is not certain that there would be a clear upswing following the Handle.
- For new traders, it is a difficult pattern to spot.
Conclusion
The cup and handle formation is easy-to-use once it is correctly identified. Once you find it, enter the trade after the handle is confirmed and the price closes above the handle. Set the target price using the Fibonacci extraction tool. When trading, it is advisable always to set a stop loss. The setup has some limitations, too, like any other chart pattern. For example, identification can be difficult for most traders.


