It is incredible how a theory of an Italian mathematician called Leonardo de Pisa, born in 1175, is still used with an impressive acceptance in the financial markets. The guy discovered and developed the Fibonacci sequence, which has many applications in our day-to-day lives.
The sequence is applicable in computer science, human behavior, natural laws, architecture, and also in trading. That’s very intriguing, right?
This theory is considered by a lot of investors in Forex to be a reliable source of important support and resistance zones based on previous movements of the price.
Some traders believe too much in the tool that they use it alone. Other traders prefer to use it in conjunction with other forms of analysis like combining with volume, moving averages, RSI, MACD, etc.
In this article, we will explain in a practical way how to configure and use the indicator in TradingView.
What is Fibonacci in trading?
Fibonacci levels in trading are the approximate points where the price can stop after a retracement or at the beginning of a new movement. This tool can help you effectively in trade management – setting the buy and sell orders or placing stop-loss and take-profit.
When we talk about this indicator, it is usually divided into two main parts:
- Retracement is used to estimate an asset’s price retracement, whether of a bullish or bearish movement, and to predict support and resistance levels.
- Extension is used to measure how far the market may go after a pullback when the price shows signs of the trend’s continuation.
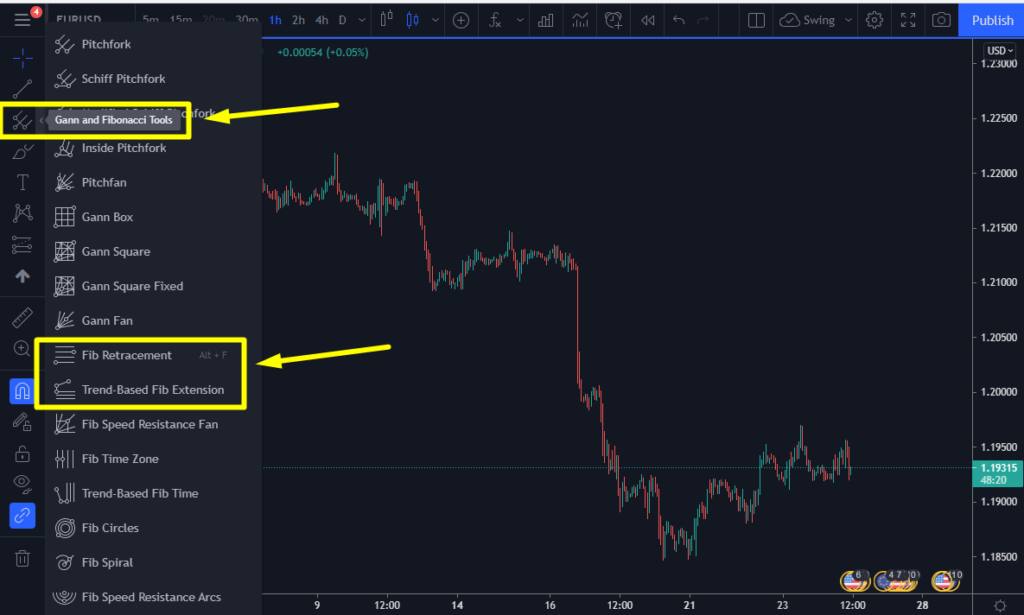
You can find those indicators on the left side of the tools on TradingView.
How to use Fibonacci Retracement?
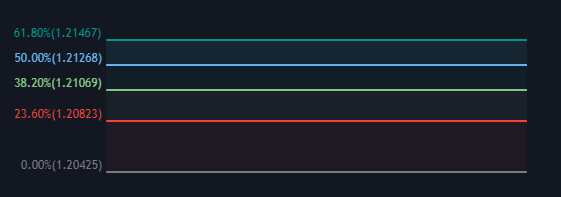
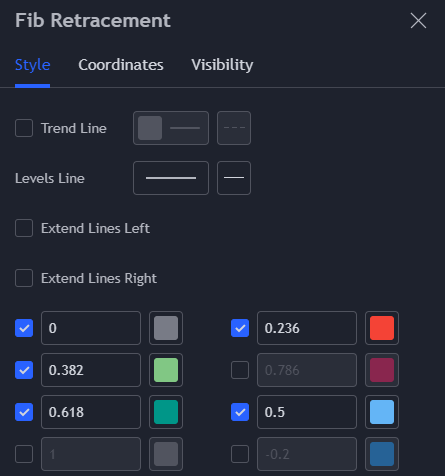
The first step is to recognize the main percentages used in a retracement of an upward or downward trend. Let’s see the primary Fibonacci levels below.
- 61,8% = 0.618
- 38,2% = 0.382
- 50% = 0.5 which does not correspond to the sequence, but results from the analysis observed in many trends. This value is the most used in predictions.
- 23,6% = 0.236
To activate these values, you have to select the tool and click on the configuration icon.
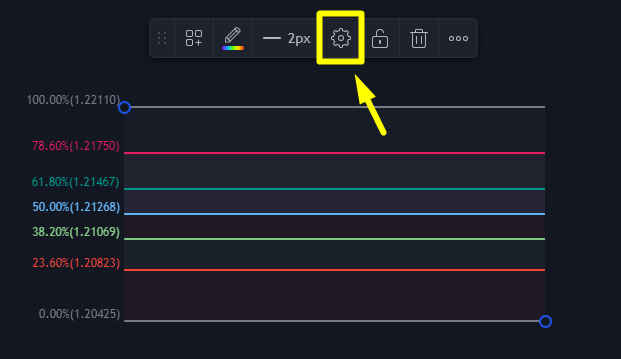
Once inside the tool, proceed to activate the boxes of the main levels that we already mentioned above.
Perfect, as we are clear about the configuration, it’s time to recognize the support and resistance points. To find those out, you need to know from where a movement began and where it ended.
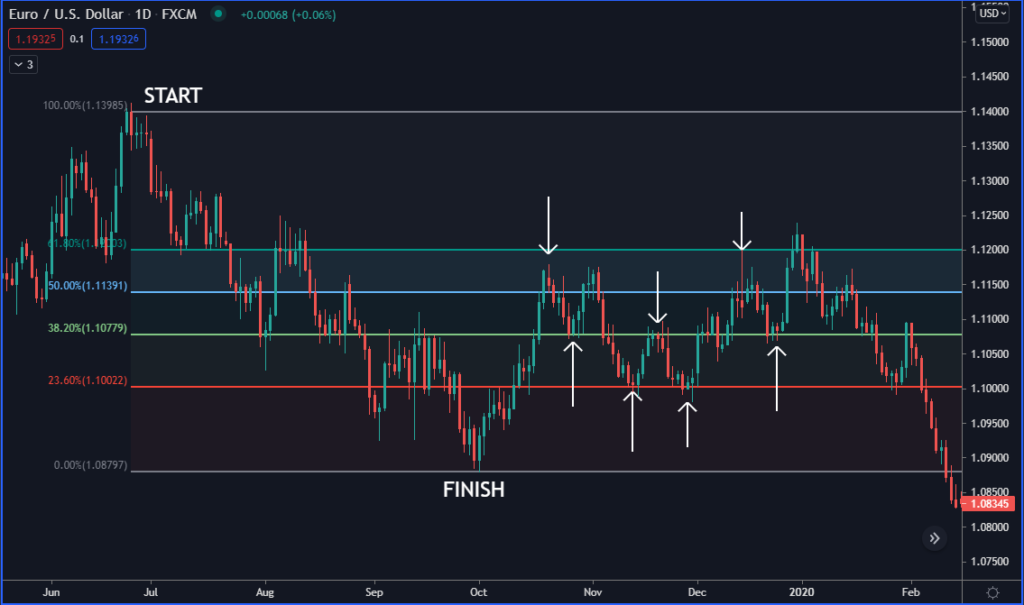
Let’s take the daily chart of the EURUSD as an example.
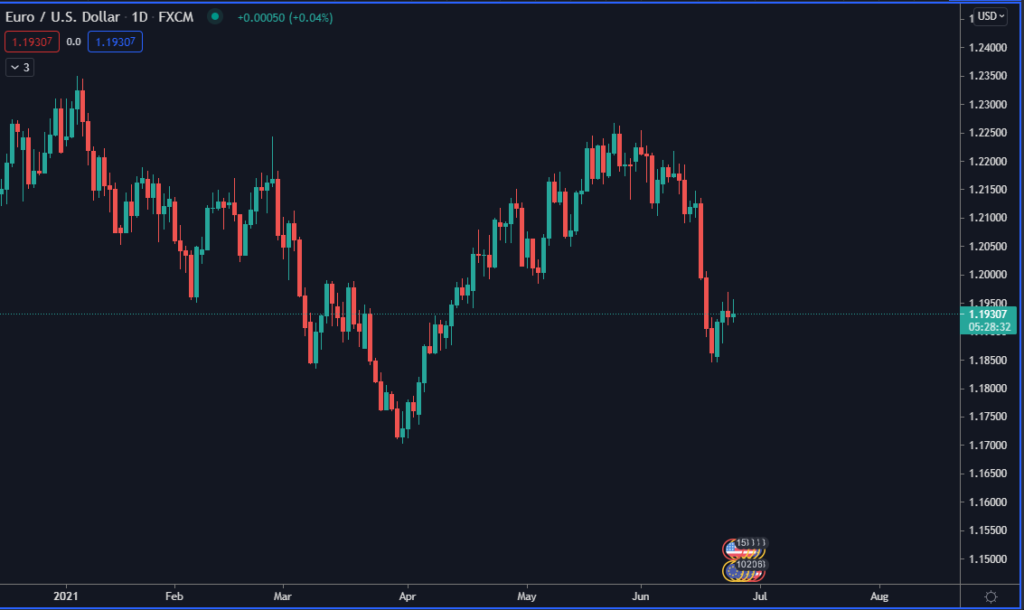
To find the retracement levels, look at the price swing and plot the indicator from the start to the finish of the move.
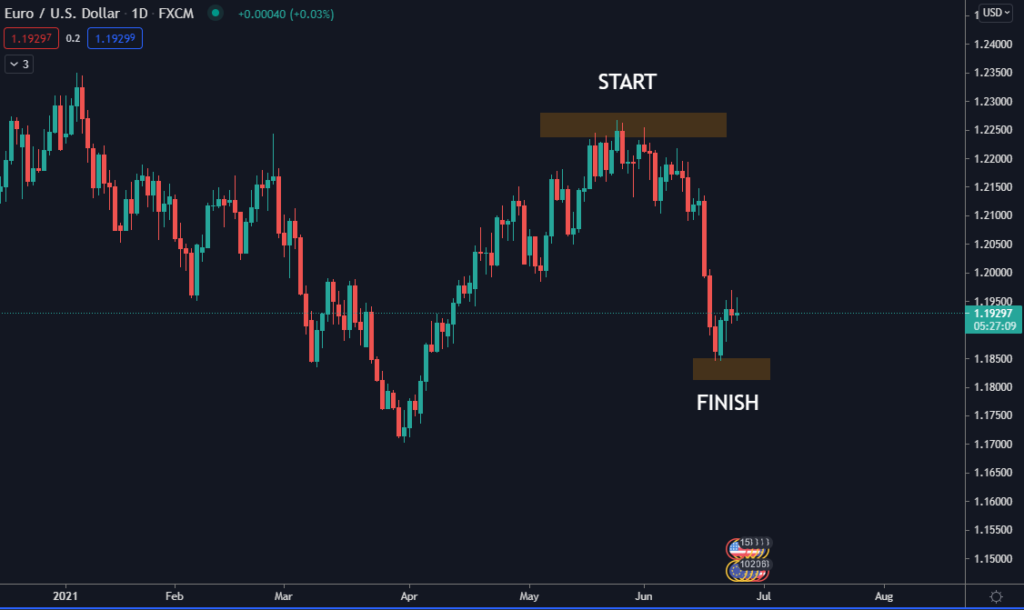
Once you find the high and low and plot the indicator, the chart will look like the one below.
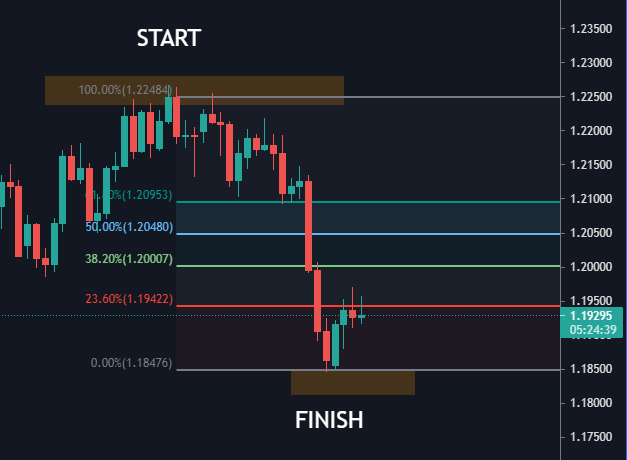
In the example above, we can see that the level 100% (resistance) is the beginning, and the 0% (support) is the end. As we analyze a downward movement, see how the price respects the 23.60% level working as resistance because of a downtrend.
Look at the chart below. The price constantly rejects different Fibonacci levels, staying in the well-defined range.
How to use Fibonacci Extension?
It’s very similar to the retracement, with the difference that we will use it when the price shows signs of recovery after a pullback in a trend.
Let’s look at this example with the GBPUSD pair.
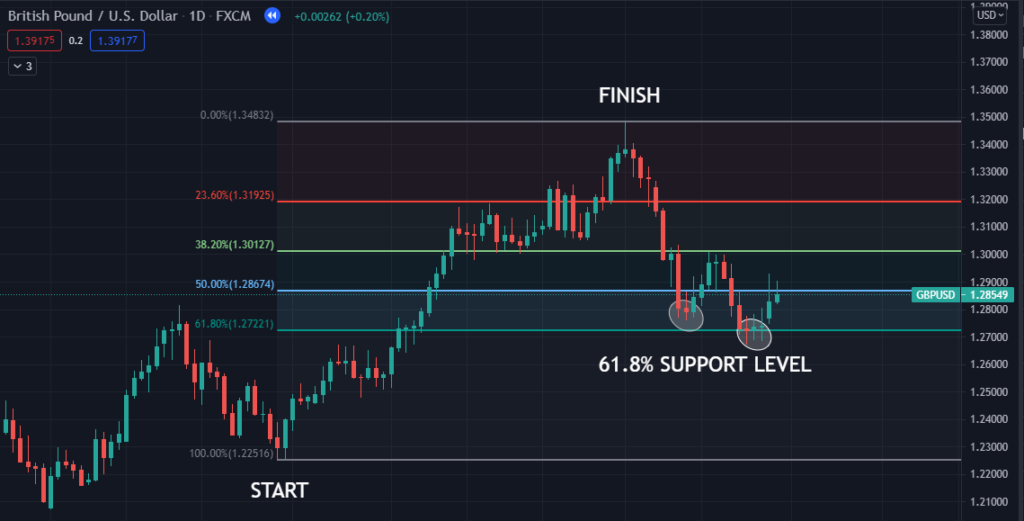
First, plot the retracement from low to high, as we’re analyzing a bullish move. Watch how the price tested the level of 61.8% and is not capable of breaking it down.
For many Forex technical analysts, the chances increase that the price may recover to the previous upper levels.
This level is considered the final one to know if the price recovers from there or it breaks that 61.8% barrier, ending up falling to 100% level.
And this is where the extension comes in. Draw it from the start to the finish that we already had drawn. Then extend it to where the price reached the level of 61.8%.
Do it in the ABC order, as you will see in the example below.
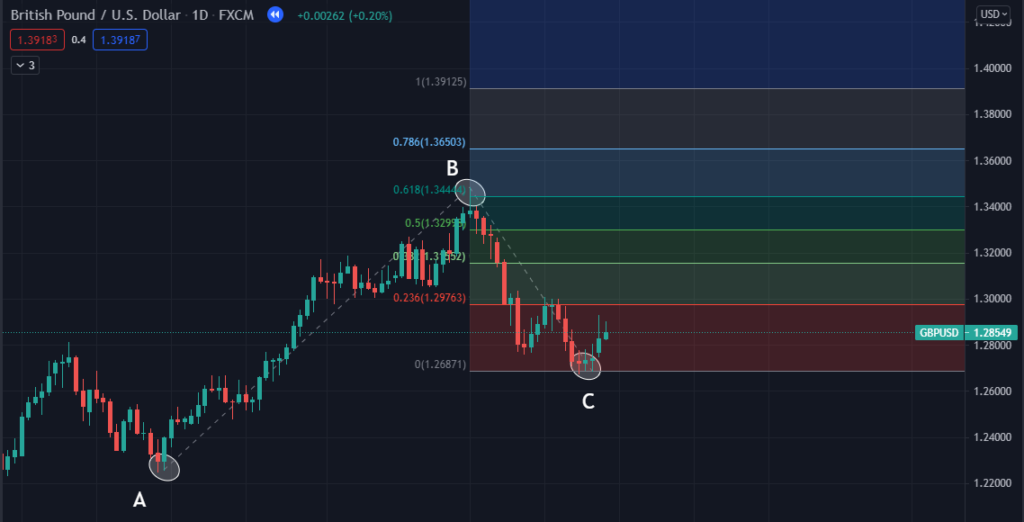
What the extension provides us are new levels to which the price can arrive once the recovery begins. These levels are editable; we can remove or add the levels that interest us the most.
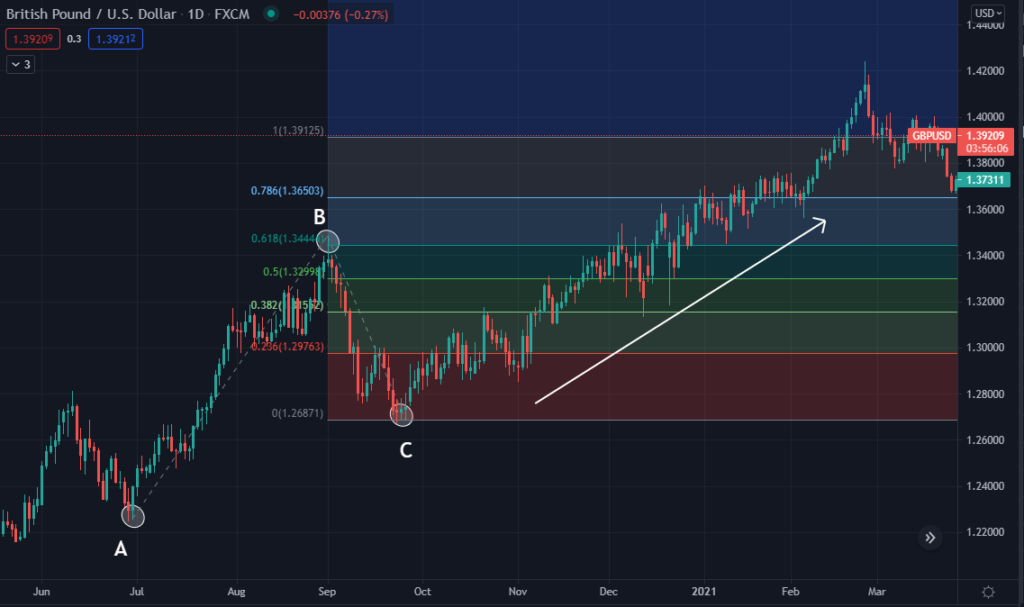
Therefore, assuming that we enter buy at point C, we would place our take profit based on the levels offered by the Extension. Our stop loss would be below zone C, offering us a good setup in terms of risk-reward.
Summary and final recommendations
Fibonacci allows us to mark important support and/or resistance areas where the price can reverse or stay in range.
Of course, when volatility increases, it is very likely that the market will ignore the levels. For that reason, analysts recommend the use of the indicator in higher time frames like daily or weekly, so we have a better chance of eliminating the noise caused by news.
The percentage levels of the tool should not be taken as long or as short points by themselves. It is more efficient and can give us more probabilities when the indicator is combined with other technical signals that confirm the suitability of the entry.
For example, many traders watch and analyze the difference in volume when the price reaches the key levels to interpret the market’s future direction better and build your strategies.


