
The falling wedge pattern is marked by a downward slope in the prices where the trend lines form a triangle indicating a convergence. After the formation of the intersecting trendlines (wedges), the price movement that originally begins as a downtrend can adopt a bullish reversal in the short term. Consequently, an uptrend from the descending wedges will be supported by an upward breakout.
In the case of a downward breakout, where the descending wedge is followed by a downtrend in prices, a bearish continuation envelope is in the short-term. Descending wedges that lead to reversals perform better than continuations. In this case, traders that spot falling wedges will have a stronger prediction in the bullish trend as compared to bearish continuation.
Wedge identification
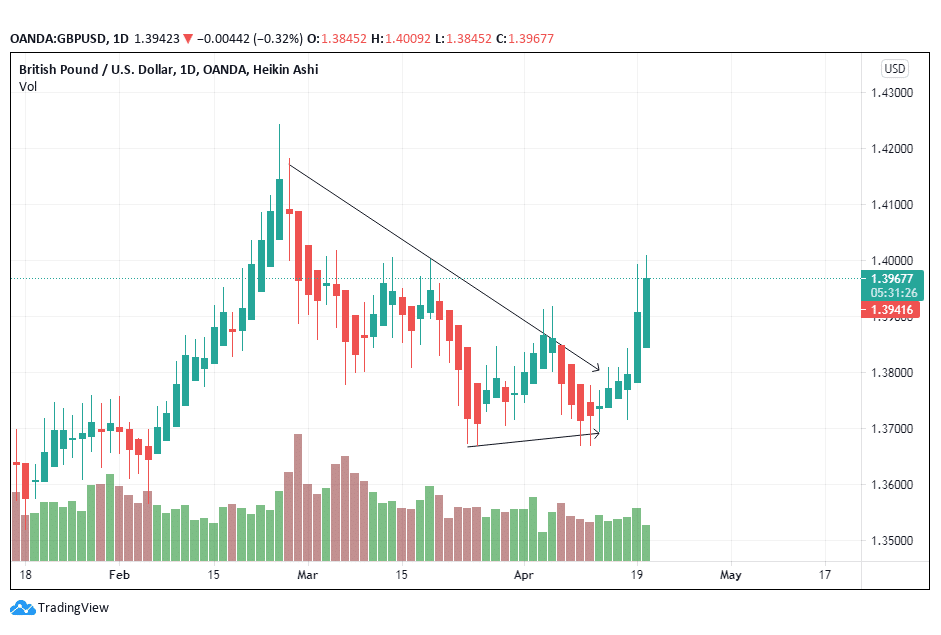
Figure 1: Wedge pattern of the GBP/USD
Volume movement across the trading chart is random from the beginning of the descending wedge to the end of the triangle pattern.
The GBP/USD, as shown in figure 1, opened trading on February 25, 2021, at a low of 1.4143. It closed at a low of 1.3746 on April 12, 2021. The falling wedge pattern was formed from a price decline of 2.89% in close to 50 days.
- Spot the two sloping price trend-lines
The price action in a falling wedge is delineated by two down-sloping trendlines. While both lines slope downwards, they should not be parallel. The upper line is steeper and longer as compared to the bottom line. Extrapolation of the trend lines will mean that they both intersect at the bottom edge.
The culmination can also be viewed when prices form an upward breakout. In figure 1, prices attempt to break upwards in three stages, 1) March 10, 2021, March 25, 2021, and 3) April 12, 2021. The first uptrend is at 1.3823, and the last occurs at 1.3746.
- Multiple touches
The top trendline in the falling wedge pattern touches at least 3 points in the price chart. In figure 1, the top line has touched 5 points on the trend before reaching the bullish reversal. There are also various minor highs and lows as the chart narrows down to the lowest position. It is this formation that leads to the wedge pattern.
Further, the top line begins from a high price point, while the lower trendline starts from a low price point. After an upward breakout, prices will tend to rise higher or close to the top price point from where the wedge formation began. In a downward breakout, prices will seek resistance at the lower price point, where the wedge formation began.
- Sloping volume
Volume declines after the wedge pattern begin to form. It recedes all through the descending triangle until the upward breakout is established. Traders should prepare to buy after the volume reaches a trend low. The downslope signals a buy option. After the breakout, volume increases concurrently with the price.
- 21-day minimum wedge formation
A wedge takes a minimum of three weeks or 21 days to form. It can take a maximum of 4 months, depending on the price pattern. The extent of the minor lows and highs also determines the length of the wedge pattern.
The falling wedge formation in figure 1 took at least 40 days to finish the formation. This time is significant in cementing the trader’s perspective. After confirming the upward breakout, we expect a price increase to follow due to the bullish reversal aspect in the short term.
Trading guidelines
- Identify the target price
Just like with many other patterns, the wedge formation will be used in identifying the target price. The trader should locate the upper portion, where the top trend-line begins.
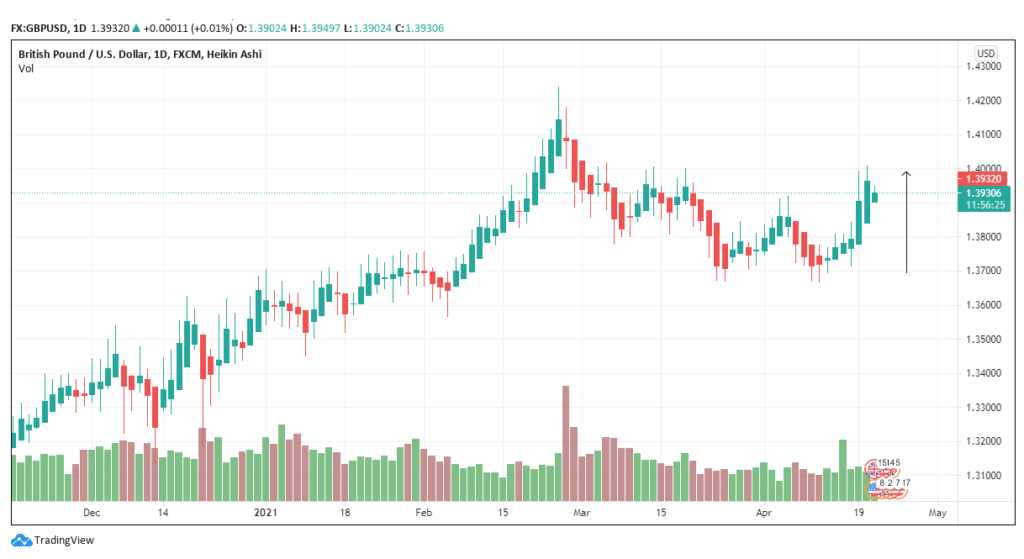
Figure 2: GBP/USD Daily Price movement
In figure 2, the wedge begins at 1.4143. We may expect the price to find resistance at 1.4100. It may also use the new price as the support base if the underlying fundamentals are in support of the pound against the dollar. Further, as of April 21, 2021, daily prices were on an uptrend in response to the momentum of the wedge formation.
- Buy at the breakout
During the formation of the wedge pattern, various false breakouts were established. Avoid the false breakouts as they may be minor highs or retracements that are quickly followed by a corrective pattern. In most cases, a longer retracement precedes an actual upward breakout.
In figure 2, the longest retracement during the formation of the wedge occurs from March 26, 2021, at 1.3790 to April 6, 2021, at 1.3911, an increase of +0.88%. Prices then broke out after hitting a low of 1.3746 on April 12, 2021.
The breakout price is the upward high that will take place on the following day. At this price, the wedge gives the buy signal for the trader. Initiate the buy trade here. On April 13, 2021, prices opened at 1.3753 and continued rising until reaching a high of 1.3939 on April 20, 2021. At this price, the trader will have gained 1,860 pips. This profit is significant, showing the strength of the falling wedge after successful identification.
Therefore, you should wait until the wedge hits the lowest low and watch for the confirmation of the upward breakout. Buy after identifying the breakout price. In case you notice, the wedge continues to descend rather than hit a reversal prepared to sell as opposed to buy.
- Use a stop-loss
The stop-loss will come in handy, especially when you miss identifying the breakout. In case you want to trade on the throwback or pullback, place a stop-loss at least 20 pips below the trading price (in a buy) or 20 pips above the trading price (when selling).
Conclusion
The falling wedge pattern mostly indicates a short-term bullish reversal. While it may also denote a downward breakout, the trader should be careful not to miss the chance of reversals along with the chart. Buy at the breakout to ensure maximum profits after identifying the wedge.


