Traders need to be alert for reversal patterns when trading trends. Reversal patterns are helpful as they can signal a turn before other fundamentals do. For a trader who is bearish on a currency pair but its trending higher, a reversal pattern can help them avoid fighting the trend too early. By waiting for a technical reversal pattern before entering the market, traders will have both the fundamentals as well as the technical aspects on their side.
Double and Triple Tops
Double and Triple Tops are a type of technical analysis chart pattern. It signals that an uptrend is over when the pattern fully forms, with the downtrend likely underway. These reversal patterns occur across futures, stock and forex markets, as well as across time frames. A double top can be identified when the price reaches a high point, retraces, and then rallies back to a similar high point, subsequently declining again.
A triple top on the other hand occurs when the price peaks, retraces, and rallies back to a similar peak. It then retraces again, rallies to a similar high, and then declines again. There are three price peaks in the same price area in this case and includes two retracements as well. Traders can use a trendline to connect the two retracement lows, extending it to the right, which they can then use for trading and analyzing purposes.
Understanding the Levels
It may happen that the market seems like hitting a brick wall at a particular level and cannot get through even after trying three to four times. This is indicative of the presence of a large resting order from a patient market participant who has a big size to move. More and more people start to notice the particular level as high or low. Therefore, by the time the trader gets a triple or quadruple top, the level is already important as everyone is noticing it.
Traders can use double and triple tops as an excuse for the reduction of a profitable position. They can also use them as breakout levels for jumping on to an existing trend. They should expect a new round of demand from stop loss sellers and longs who start to add to their positions once the double or triple top breaks.
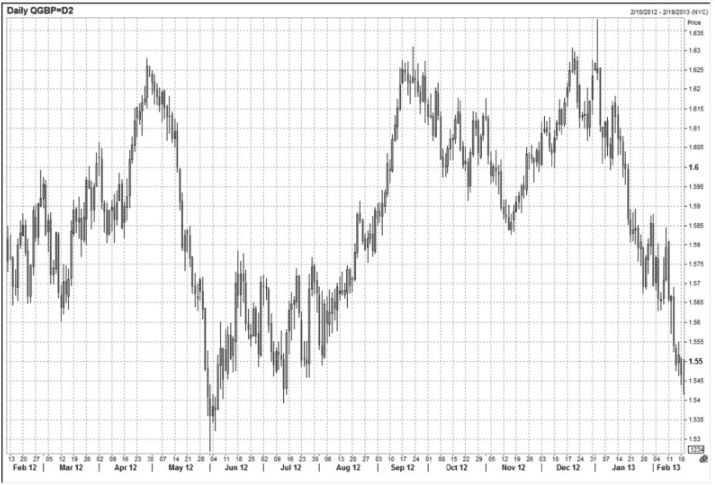
The above graph shows a triple top at 1.6280 for the GBP/USD in 2012. The long wicks on the daily candles indicate the presence of several intraday stabs through the level where the triple top forms. At the end of 2012, there is an aggressive spike to 1.6380. However, the 1.6280 level held all three times on a daily closing basis, signaling the heavy distribution or selling of GBP.
Another thing to note here is the failure to hold above 1.6280, giving rise to a textbook Slingshot Reversal formation.
Example of Double and Triple Top
The Double and Triple Top is a simple yet effective set up. Since the USD/CAD pair has rallied relentlessly, traders become bearish on it. They may be expecting reasons such as oil going higher for fundamental reasons, or that the bank of Canada is worried about currency weakness. The USD/CAD then rallies to the topside 100-hour deviation.
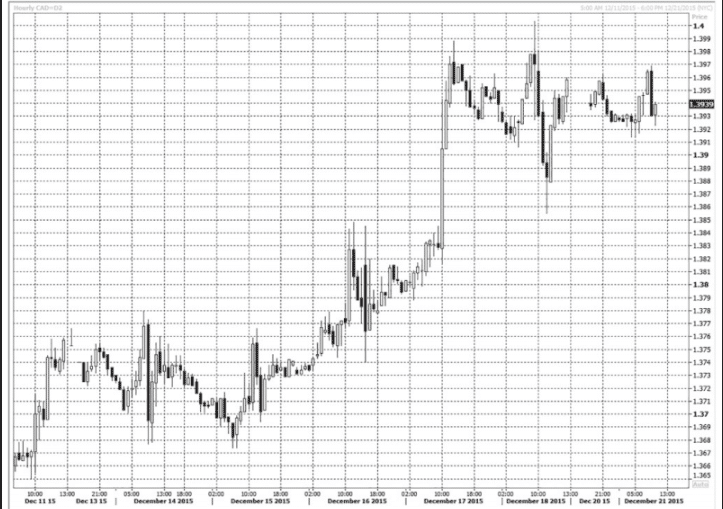
The chart above represents the USD/CAD hourly, from the period December 11 to December 21, 2015. Here, there is a major round-number resistance at 1.4000 which the pair is bumping against. After failing three or four times, it forms a triple or quadruple top. Other than rare instances such as the internet and tech bubble, the USD/CAD throughout history has rarely sustained moves beyond 1.4000.
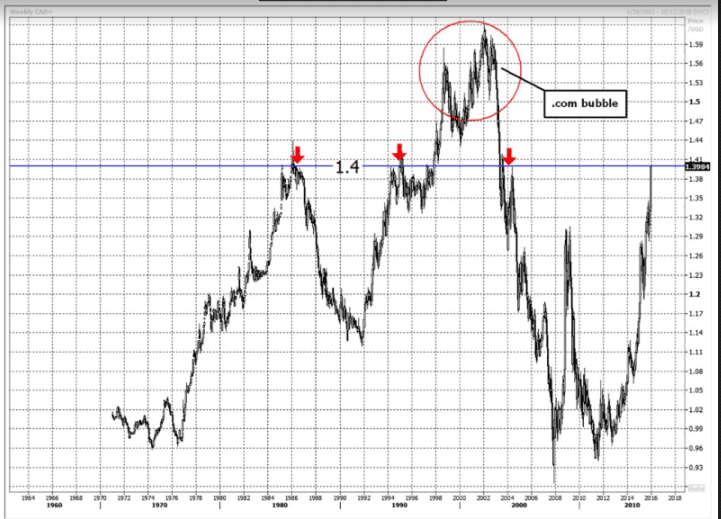
The above graph shows the daily USD/CAD. Here the dotcom bubble is marked at 1971. During the period 1971 to 2014 the USD/CAD has trouble staying above 1.40, other than the tech bubble.
This setup is helpful as it allows traders to sell with leverage as they risking just a little. They can simply sell near the double or triple top, putting a stop above it. Here, traders should sell at the multiple tops at 1.3980. They can put a stop loss on the other side, i.e. 1.4017.
The stop is far enough, only to withstand a minor breach of up to 1.4000. Traders can take a big position when they trade such tight entry/stop loss. Because they aren’t risking much, traders can leverage their position aggressively. In this case, by risking only 37 pips, traders can find opportunities of making 100 or even 150 pips on a single trade.
Conclusion
Traders should select those patterns where the potential reward is at least twice as much as their risk. Double and Triple tops are traded in different ways, which involve different entry points, stops, etc. Traders thus need to assess which patterns are worth trading and which aren’t. When trading this pattern, more emphasis should be given on finding short entry positions instead of long taking long positions.


