
Trend following is an approach where the market participants aim to benefit from existing trends. It differs from other methods like breakouts because traders are only interested in following an already-formed trend. In this piece, we will look at what it is, how to use it in trading, and some of the best indicators to use.
What is trend-following?
A trend refers to a situation where a financial asset like a currency pair, stock, index, and exchange-traded fund is consistently rising or declining. It differs from consolidation, a period where the asset is in a narrow range. It also differs in a period of high volatility where the asset is making significant swings in a given period.
Therefore, trend following refers to a situation where a trader or investor waits for a trend to form and then follows it. To a large extent, it uses Newton’s law of motion, which states that an object in motion will move in the same direction until it is attacked by an opposite force.
To a large extent, trend following is the most popular trading strategy. Furthermore, as traders, we want to buy and hold an asset whose price is rising and short the one whose price is falling. We aim to hold such trades until a time when they start to deviate from the trend.
There are many strategies used in a trend-following strategy. One of them combines both price action strategies and technical indicators.
Moving averages
Moving averages (MA) are used by all types of participants, including scalpers and swing traders. In general, MAs attempt to find the average price of an asset in a certain period of time. For example, the 14-day SMA of a currency pair shows the average price where it has traded in that period.
There are several types of moving averages, including exponential, Hull, weighted, smoothed, and Arnaud Legoux. All these averages are based on the same principles, and they generally show the same thing. They all attempt to reduce the lag found in the SMA.
MAs are excellent trend-following indicators. Generally, traders use them to identify situations where the asset’s bullish or bearish trend is about to end. Let’s look at an example.
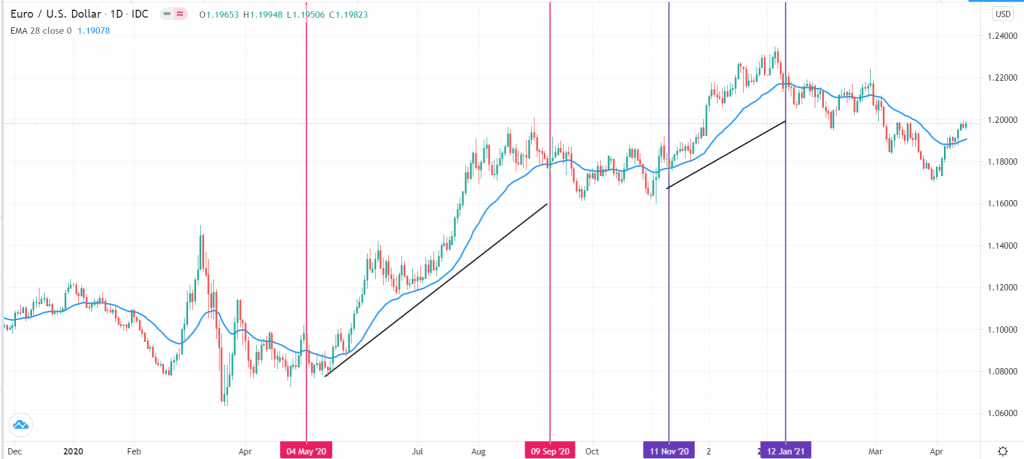
In the chart below, we see that the EUR/USD started a bullish trend in May 2020. The 28-day EMA has also been applied in the chart. Therefore, in this case, we see that the bullish trend remained as long as the price was above this MA.
Another bullish trend started in November and lasted until January 2021. Similarly, the price remained above the moving average. Therefore, in the two situations, a trend follower would have remained bullish until when the price moved below the MA.
MA example
Bollinger Bands
Bollinger Bands is a popular day trading indicator. The indicator has three bands, with the middle one being a moving average. The upper and lower lines are formed by finding the standard deviation.
There are several strategies for using the Bollinger Bands. Some traders use them to find the amount of volatility in a financial asset. Ideally, in a low-volatility environment, the three bands will be close. On the other hand, the width of the indicator usually increases in periods of high volatility.
The bands are also popular in trend following. Typically, in theory, the bullish trend will remain so long as the price is between the middle and the upper side of the bands. Similarly, it will remain in a bearish trend so long as the price is between the middle and lower line. An exit point emerges when the price moves below or above the neutral line.
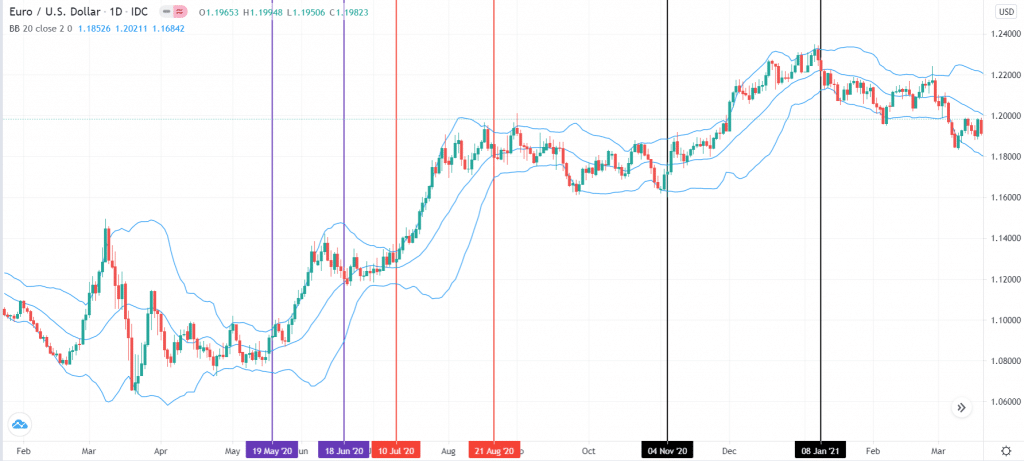
An example of how to use BB in this approach is on the EUR/USD chart shown below. In the three highlighted sections of the chart, we see that the bullish trend held steady as long as the price was between the middle and upper side of the bands. Therefore, as a bullish trend follower, any time that the price is between the two is a safe point for you to hold steady.
Bollinger Bands example
Parabolic SAR
The Parabolic Stop and Reverse (SAR) is another less famous technical indicator. It was developed by Welles Wilder and usually looks like a series of dots. The indicator is one of the most complex to calculate, even when using tools like Microsoft Excel.
However, using it in trend following is a relatively easy process. Ideally, in an uptrend, the Parabolic SAR will remain below the price. Similarly, in a downtrend, the indicator’s dots will remain above the price. Therefore, the exit point happens when the dots move above or below the price.
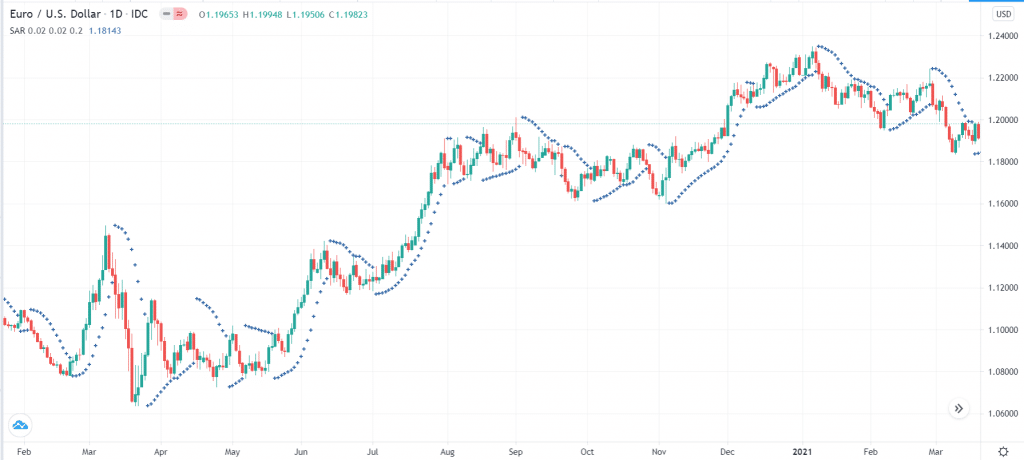
For example, in the chart below, we see that the EUR/USD pair remained in a bullish trend when the Parabolic SAR was below the price.
Parabolic SAR example
Relative Strength Index (RSI)
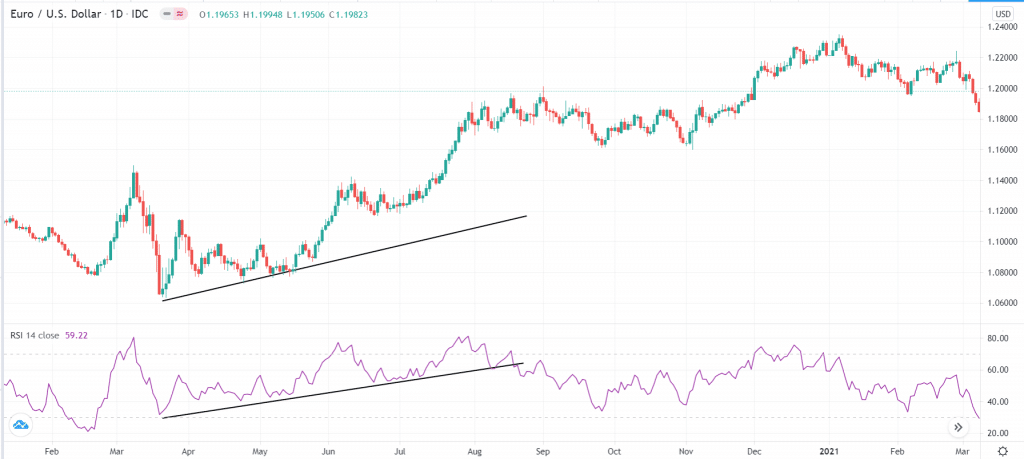
The RSI is a popular tool that is mostly used to identify extreme levels in the market. The indicator normally measures the rate of change of the asset. Any move below 30 is said to be oversold. Any moves above 70 are usually overbought. To use the RSI in this approach, traders typically look at how it’s moving. If the RSI is moving upwards, it is a sign that the price is bullish, as shown below. Similarly, if the price and the RSI are falling, it is usually a signal to short.
RSI in trend following example
Final thoughts
Trend following is an excellent trading approach that works. When used well, it has minimal risks and the rewards can be excellent. Trend followers use different strategies to find buying and selling positions. Others that work well when using the strategy are Envelopes, Average Directional Index (ADX), and the MACD.


