The Fibonacci sequence is used in the forex market in various ways. A popular tool derived from the Fibonacci is the Fibonacci retracement tool which is also used in indicators such as Gartley patterns, Tirone levels, and Elliot Wave theory. The Fibonacci sequence however is simple, beginning with 0 and 1. The sequence is as follows: 0, 1, 1, 2, 3, 5, 8, 13, 21, 34, 55, 89, 144, and so on. Fibonacci analysis is the study of the identification of potential support and resistance levels in the future after considering past price trends and reversals.
What are Fibonacci Projections?
Trends do not move in a linear pattern up or down. They instead move in one direction initially consequently pulling back down and moves in the opposite direction. They can then turn around again and resume moving in the previous direction, completing the natural flow of a trend. In forex trading when a currency pair resumes its previous trend, traders naturally want to know how far the pair can continue to move. In this context, Fibonacci projections can help. Some Fibonacci ratios are useful in this case when you are trying to find out how far a currency pair will move once it resumes its previous trend. These ratios include 161.8 percent, 261.8 percent, and 423.8 percent.
If you determine all these three Fibonacci projection levels, you will get the potential resistance and support levels to use in trading. These Fibonacci levels are perfectly illustrated in the daily GBP/USD chart.

Here it has the potential to move up to the 161.8 projection level eventually. When it reaches this level, set your next profit target level at 261.8%.
Using Fibonacci Retracements
Forex traders have a tendency to ask about how far a currency pair is most likely to move in the new direction whenever they reverse a trend. Fibonacci retracement levels can help in this aspect. There are certain ratios that can help you when determining how far a currency pair is going to retrace. They can also be used to determine how far a currency will move against a previous trend.
Ratios used to help find retracement levels
- 61.8% (55/89)
- 38.2%( 34/89)
- 23.6%( 21/89)
Additionally, you will find three other levels when conducting your retracement analysis. The following levels are not calculated using numbers from the Fibonacci sequence but are based on the Fibonacci levels discussed above.
- 50%
- 76.4%
- 100%
By determining all 6 Fibonacci retracement levels, you will get the potential support and resistance levels.
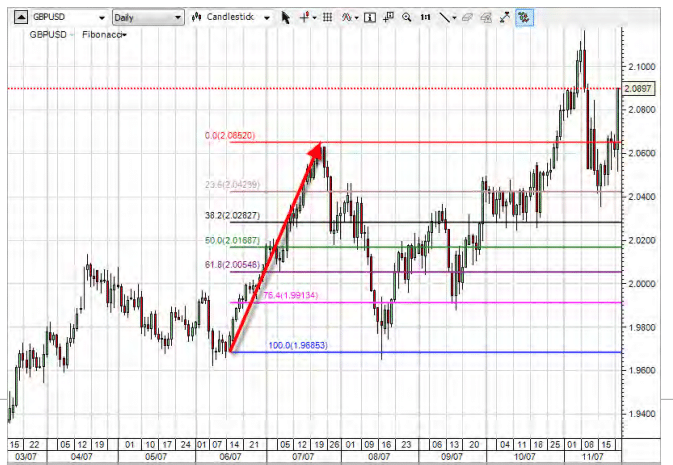
In the above daily charts for GBP/USD, each of these levels is highlighted. They are calculated based on the trend which the red arrow highlights. You can use each of these levels to help determine when finding out when to enter and exit your trades as GBP/USD turns around and moves lower. Also notice how the price moves back and forth, bouncing off these support and resistance levels. It finally breaks back above the high established by the previous trend in late October.
The market typically retraces after a strong move before continuing and does not always hit the levels consistently. For instance, the price may reverse midway between 50% and 61.8%. Price can undershoot or overshoot a Fibonacci level. The 61.8% and 76.4% levels are very popular for the market to retrace to. As a trader, you should watch these levels on different timescales. It is thus smart to wait for a confirmation signal before entering the trade. The most difficult part of this is knowing which level will hold.
Fibonacci Fans
Fibonacci levels can provide diagonal as well as horizontal levels of resistance and support. These diagonal levels are known as Fibonacci fans. They are based on three retracement levels: 38.2%, 50%, and 61.8%.
For implementing a Fibonacci fan, you need to first identify a trend and the three horizontal Fibonacci levels, as they relate to that trend. After this, draw a vertical line crossing through these levels at the point where the trend ends. Finally, draw 3 lines, each beginning from where the trend begins and then crosses through a separate point where the vertical line touches one of these Fibonacci levels.
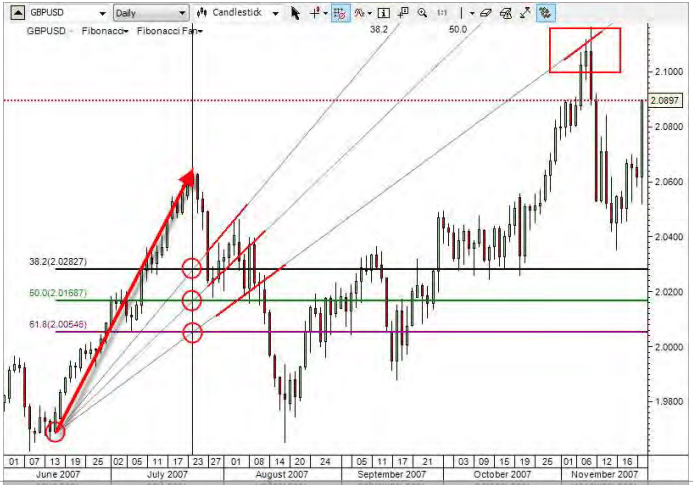
In the above GBP/USD chart, each of the Fibonacci fans was calculated based on the trend highlighted by the red arrow you see here. You can use the rays from the fan to determine when to enter and exit your trades. Also, notice how the price of the currency pair bounced off the middle ray of the fan for a while in August before breaking through that level. It then begins bouncing off the bottom ray of the fan for a couple of days.
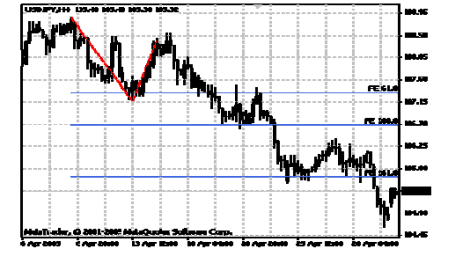
Fibonacci Expansion
Fibonacci Expansion is similar to the retracement and used for determining the end of the 3rd wave. Unlike the retracement, however, it is not built on one trend line but on 2 waves. First, you will have to draw the first wave and its height will be considered as a unit interval later on. You can build an invisible vertical line by using the end of the second wave as a reference point. The corresponding lines are drawn from the reference point on the 61.8%, 100% and 161.8% of the unit of the interval. The third wave finishes near these levels.
Final Thoughts
Fibonacci is used in all markets including online stock trading, forex trading, and also in trading futures. It goes without saying that the Fibonacci trading numbers have a special significance. The fact that they are so pervasively used creates a self-fulfilling prophecy to the levels. Thus, the Fibonacci should be included as part of your technical analysis and incorporated into the trading system.
By using Fibonacci numbers, especially the Fibonacci retracements, you won’t become a professional investor, day trader, or swing trader overnight. However, if you use it in conjunction with other technical analysis tools such as stochastics, MACD, RSI, candlesticks, and Moving averages, it can be a valued addition to your trader toolbox.


