
Cryptocurrency can be highly volatile. Ascertaining the direction price moves in shorter time frames is never easy, given the wild swings always in play. However, it becomes much easier to ascertain the underlying trend by focusing on more extended time frames.
Technical analysis relies on an array of indicators to determine the prevailing trend crucial to ascertaining entry levels. Moving Averages are some of the best indicators that technical analysts rely on to determine the direction price is moving. When two MAs are used in the analysis, it becomes much easier to spot entry and exit points and key chart patterns.
What is the Golden Cross?
The Golden Cross is a unique chart pattern that is spotted while using two Moving Averages, one fast-moving and another slow-moving. The 50 day and 200-day Moving Average are used in this case to ascertain the chart pattern.
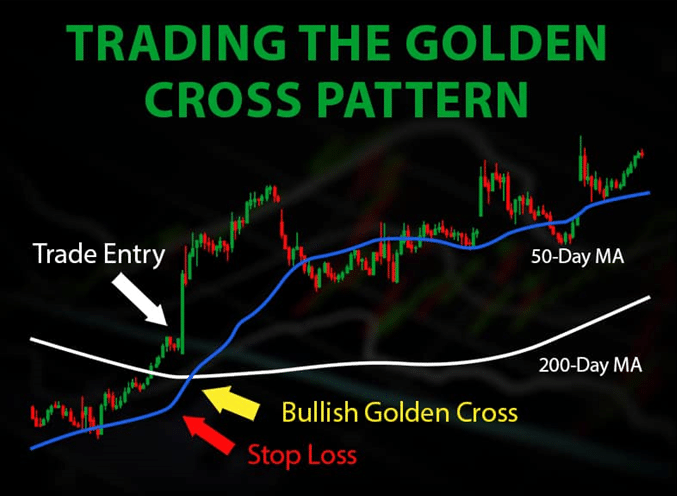
A Golden Cross is asserted when the 50-day MA crosses the 200-day MA from below and starts moving up. This implies that buyers are piling pressure on short-sellers and that momentum is slowly shifting to the upside.
Consequently, the golden cross is a bullish signal that implies the start of an uptrend. Likewise, technical analysts use this opportunity to explore potential entry positions to try and profit as prices move up. A long or buy position is preferred in this case.
How is the Golden Cross formed?
The golden cross forms when the market is in a downtrend. Steep sell-off results in the short-term Moving Average crossing the long-term MA and moving lower. The stronger the sell-off wave, the wider apart the two MAs would be, with the 50MA lower and 200MA slightly up.
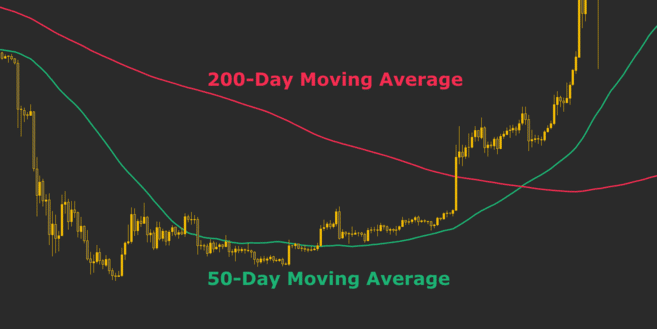
After the price has moved lower significantly, oversold conditions may kick in, as confirmed by other indicators such as the Relative Strength Index or the Stochastic. The lack of new sellers to push prices lower often results in price trading in a range with Moving Averages remaining flat.
Once the trend reverses due to a buildup in buying pressure, the short-term MA (50MA) will start moving up, signaling buyers are back in the fold and fighting the short-sellers. A significant build-up in buying pressure would cause the price to re-rate higher resulting in the short term (MA 50) crossing the long term MA (200MA).
Once the crossover happens, it implies the downtrend has reversed, and that price is well poised to edge higher amid a buildup in buying pressure.
Golden Cross with momentum indicators
For the best outcome, the golden cross pattern should be analyzed while using other indicators. Because cryptocurrencies can be extremely volatile, relying on Moving Averages for trading decisions may not always result in the best outcomes. Adding other indicators as part of technical analysis could go a long way in enhancing price prediction.
Relative Strength Index and the Stochastic are some of the best indicators that can lead to better outcomes while looking to profit from the golden cross setup. The indicators are ideal for confirming oversold and overbought conditions.
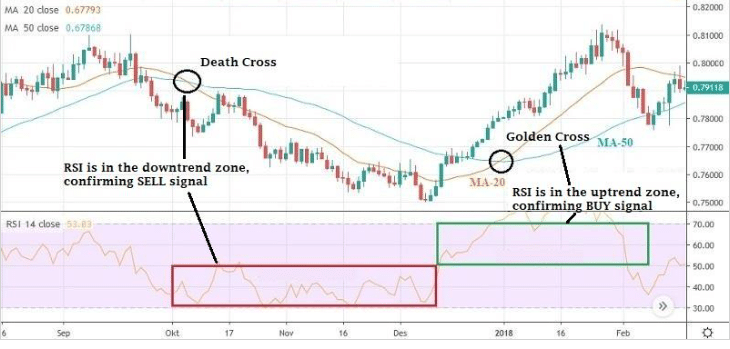
Therefore, the RSI and the Stochastic can provide early signs of when a golden cross is likely to occur. For instance, whenever the RSI reading is below 30, it implies that a cryptocurrency has been oversold significantly and that a potential reversal could occur.
This would be the perfect time to watch the 50 and 200-day Moving Average for a potential golden cross formation. While the RSI can remain oversold for a prolonged period of time, a reversal will always occur on short-sellers exiting.
Once the RSI starts reversing and starts moving up, the short-term Moving Average would also follow suit. As the buying pressure builds up, the RSI will trend up, and the 50MA will also cross the 200-day MA, resulting in a golden cross. The further apart the 50 and 200 MA become, the stronger the upward momentum
Similarly, when the Stochastic reading is below 20, the same implies that a cryptocurrency has been oversold on buildup in short selling pressure. The prospect of a reversal occurring is usually high. The fast-moving MA would also follow suit once the Stochastic starts to rise from below the 20 levels.
Once the stochastic rises above 20 due to a buildup in buying pressure, the 50MA would also trend up to the level of crossing the slow-moving 200-MA, affirming the golden cross. Consequently, a trader can use this opportunity to look for an entry-level to trigger a buy position.
Death Cross chart pattern
A death cross is the opposite of the golden cross. The chart pattern occurs during an uptrend. After the price has moved up significantly, exhaustion may kick in on buyers exiting or taking profits. The lack of buyers to push the price higher would result in a fast 50MA changing course and start moving lower.
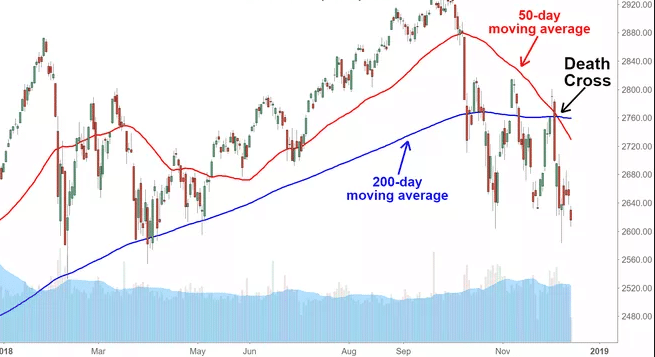
A death cross pattern is said to have happened once the 50MA tanks and crosses the slow-moving 200MA. This implies that momentum has reversed with the entry of more sellers into the market. The likelihood of price edging lower is usually high.
Consequently, market participants use this opportunity to eye-sell positions as the prospect of price tanking is usually high.
Golden cross vs. Death cross
It is clear that the golden cross and death cross are opposite of one another. A golden cross implies the start of an uptrend when it happens in a long-term chart such as a weekly or daily chart. In contrast, the death cross implies the start of a downtrend on the buildup of short selling pressure.
The golden cross pattern forms during a downtrend when the price has moved lower significantly, resulting in oversold conditions. On the other hand, the death cross pattern forms when the price has moved up significantly, resulting in overbought conditions.
In the case of a golden cross, once the crossover happens, the long-term MA becomes support. Price moving up and pulling back would often bounce off the Moving Average, affirming strong support.
In a death cross formation, the long-term Moving Average becomes the resistance level. Once the price moves lower and bounces back, short-sellers would often enter and push the price lower once the long-term MA holds up as resistance.


