- US retail sales for June 2021 (MoM) rose to 0.6% from a previous decline of 1.7%.
- Treasury and IRS disbursed $15 billion to families in July 2021 as a child tax credit.
- China’s coal production declined 5% to 320 million tons in June 2021.
The USDCNY pair added 0.34% on July 16, 2021, from the previous day’s close. It opened trading at 6.4638 and rose to a high of 6.4798. The US dollar surged against the Chinese yuan after retail sales for June 2021 (MoM) rose to 0.6% from a previous decline of 1.7%. Consensus estimates had predicted retail sales to drop 0.4%, looking at slow economic recovery.
May 2021 also saw core retail sales jump 1.3% to $709.8 billion from $700.4 billion realized in April 2021.
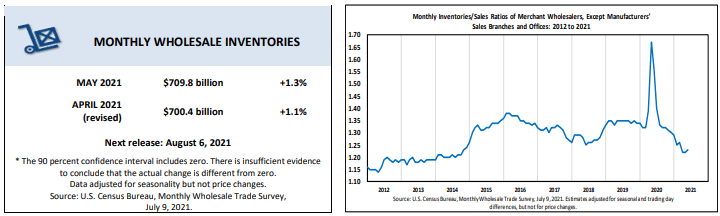
US Wholesale trade for June 2021
The retail sales beat estimates at 0.4% from a previous decline of 0.9%.
Child tax credit
The US dollar shot up after the Treasury Department and the IRS announced that approximately $15 billion had been disbursed to families in July 2021. The payment was made to close to 60 million children eligible for the tax credit under the American Rescue Plan (ARP) ratified in March 2021 by the Biden Administration.
Eligible children under six years received a monthly payment of up to $300, while those between 6 and 17 years received a monthly remittance of $250. The amount has increased by 80% annually for children under six years (to $3,600) and 50% for those between 6-17 years under Biden’s presidency.
However, the 1-year change has seen the US dollar lose 7.32% against the yuan.
Chinese households’ income
Disposable income among Chinese households in the first half of 2021 nominally increased 12.6% (YoY) to 17,642 yuan. Over the same period, the median disposable income (per capita) also increased by 11.6% to 14,897 yuan.
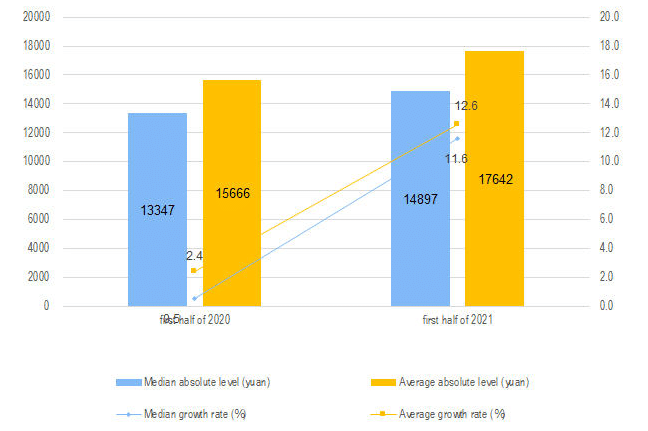
Chinese Household Income Comparative Graphs (2020-2021)
Disposable income among urban Chinese residents rose 11.4% (on nominal terms- YoY) to 24,125 yuan. The median disposable income (per capita) among the urban dwellers also surged 9.7% to 21,517 yuan, indicating the economy’s positive response to China’s monetary policies.
Unlike the US Fed that embraced quantitative easing (QE) and reduction of borrowing costs to foster credit, the Chinese government opted to invest in the infrastructural stimulus. Among the projects that received funding under the stimulus plan include the Yangtze River Delta and the Greater Bay Area.
China had lined up between 10 trillion to 17.5 trillion yuan as investment capital for infrastructural projects to cushion the global powerhouse from the pandemic’s effects. The investment is supposed to end in 2025.
To help the real economy, the People’s Bank of China (PBC) announced in July 2021 that it would lower the reserve requirement ratio (RRR) for Chinese commercial banks by 0.5% points. This decrease would see the release of liquidity worth 1 trillion yuan ($154 billion). While this move was, however, strategic in helping to repay 400-billion-yuan ($62 billion) worth of lending facility to commercial banks, it led to a decrease in infrastructural capital.
Coal output
June 2021 saw a 5% reduction in coal production to 320 million tons.
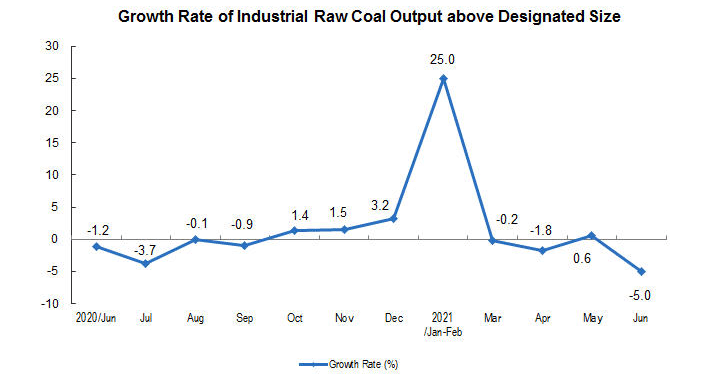
Coal Production in China
China’s coal production between January and June 2021 stood at 1.95 billion tons. It represented a growth of 6.4% (YoY).
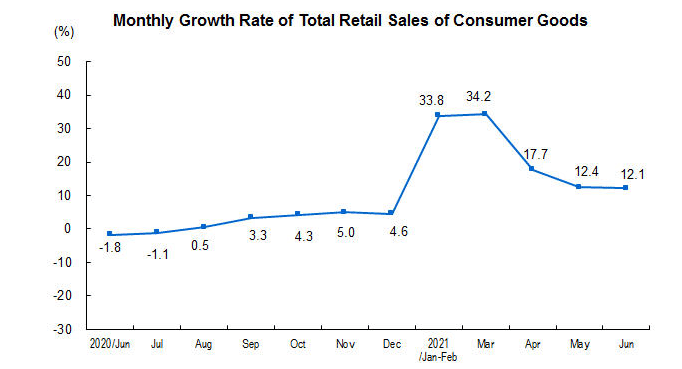
China’s total retail sales
While retail sales surged to 12.1% for June 2021 (YoY) to 3.7586 trillion yuan, they represented a decline from the previous reading of 12.4%.
Technical analysis
The USDCNY pair formed a cup-with-handle pattern with an upward breakout. The throwback is part of the partial decline occurring just before the bullish continuation takes shape.
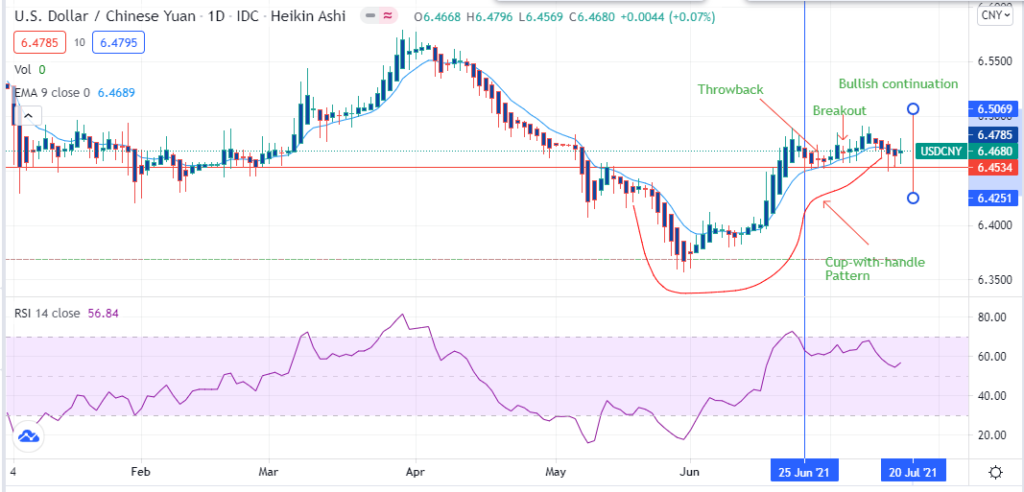
The throwback occurred from June 25, 2021, with the upward breakout visible at 6.4534. We expect the uptrend to move towards 6.5069 after the upward breakout. Failure of the uptrend to continue may push the price lower towards 6.4251.


