
Traders leverage various tools and strategies to try and predict future price movements in the global financial markets. Technical indicators are often at the heart of the majority of predictions that take place. Likewise, people analyze and study different price patterns, all in speculating about future price movements. Harmonic price patterns are most often studied and leveraged when it comes to price prediction.
Harmonic patterns accrue their edge on the fact that they help people spot possible retracements in price action. The advanced patterns have a connection with Fibonacci sequence numbers and require additional tools and information to validate trade opportunities.
Popular Harmonic Patterns
- ABCD Pattern
- Three-Drive Pattern
- Gartley Pattern
- Butterfly Pattern
The ABCD pattern
It is the simplest and basic harmonic pattern. However, hawk-eyes are needed if one identifies this pattern in a price chart.
The ABCD price pattern is based on the fact that prices don’t move in one direction. Corrections always come into play on price, hitting a significant resistance or support level resulting in a correction.
The price rallied from point A to point B and reversed upon hitting a resistance level in the chart above. Given the strength of the upward momentum, price only corrected to point C before rallying to point D. In most cases, and the extension AB would often be replicated, as is the case, in CD one price bounces and starts moving in the direction of the primary trend.
Using the Fibonacci retracement tool on leg AB the correction on leg BC would often be until level 0.618. Similarly, the line CD would extend to 1.272 on the Fibonacci from point BC.
Two things to remember:
The AB extension length should be equal to that of extension CD.
The time it takes for the price to move from point A to B should be the same as the time it takes to move from C to D.
Three drives pattern
The three drives pattern shares the same attributes as the ABCD pattern. However, in its case, there are three legs in any direction and two retracements.
The price is seen trending upwards in the chart above but experiences strong resistance at point 1 and corrects lower. With the help of a Fibonacci tool, it should be clear that the correction will end at point A, which is at .618.
As price bounces back and rallies, it should end at point 2, which is at 1.272 on the Fibonacci level. Upon experiencing resistance, rejection could drive the price lower, close to 0.618 on the Fibonacci level. Buyers are fond of opening positions on corrections and would certainly jump at the opportunity to buy at point B, which is a correction at .618 on the Fibonacci. From point B, the price would often rally to point three on increased buying pressure.
It is important to remember that the time the price takes to rally to point 1 should be the same it takes to rally from point A to 2 and from 3.
The Gartley pattern
The Gartley pattern is a harmonic pattern that simplifies what to buy and when to buy in the market.
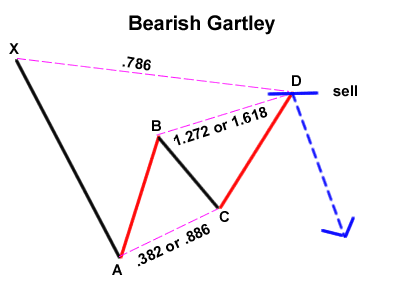
The pattern comes into play whenever there is a big correction from the primary trend. Consider the chart above whereby the price is seen moving lower from X to A. However, the downward pressure loses momentum, and the price bounces to point B.
The retracement on the Fibonacci tool should be .618 of the larger XA move. While in most cases, it is expected that price would correct lower from point C, with these patterns, that is never the case. Instead, the price corrects higher from point C to D, usually .886 of the larger XA move.
Given the strength of the downward momentum, it is often expected that from D, the price would correct lower beyond point A in continuation of the long-term downtrend on increased selling pressure.
The butterfly harmonic pattern
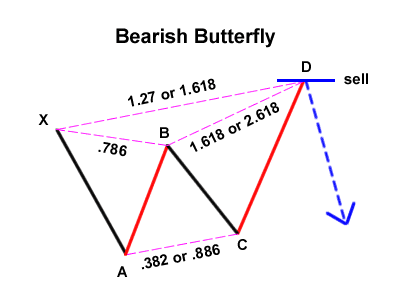
The butterfly harmonic pattern is ideal for traders eyeing big pips while trading. In case a security is in a downtrend, as is the case in the chart above, a correction would often occur on price moving lower for an extended period.
If this were to happen, the bounce-back AB should be .786 of the larger move lower, in this case, XA. While it is often expected that price would edge lower after being rejected at point B, that is not always the case with this pattern.
Likewise, a move BC would often be .382 of move AB from where the price would often really one can find to point D with the CD retracement being 1.618 extensions of move AB. Similarly, retracement CD should be 1.27 of move XA.
It is from point D that most selling would occur after the two-wave correction. Most short sellers would wait for the price to correct higher to gain more room to lower the price.
Harmonic pattern drawbacks
Harmonic patterns present a string of challenges even to the most experienced traders, given that they are precise. For instance, people could see a pattern that looks like a harmonic pattern only for Fibonacci levels not to align.
Such patterns are also subject to failures and would often fail to pan out as expected. If this were to happen, the risk of being caught on the wrong side of a trade is usually high, leading to significant losses.
Bottom line
Harmonic patterns present precise ways of trading financial instruments. While it requires lots of patients to identify the actual patterns, years of experience are needed to master the various patterns and how they influence trader’s sentiments and price action.
By simply locating a potential harmonic pattern, measuring it using a Fibonacci retracement tool, it becomes easy to identify where the price is likely to end after a correction. Entry points are usually at the end of a correction, while stop losses are placed slightly above the entry points.


