
What is the TRIX, and how do you use it in forex? This article will cover how this indicator is constructed and some examples of its usefulness in trading.
Are you interested in trading with ‘tricks’ (no pun intended)? Well, every trader wishes so, but this article will speak about the TRIX or the triple exponential average, an interesting indicator developed by legendary American trader and author Jack Hutson.
The TRIX is primarily a momentum indicator operating in a similar vein to popular oscillators like the MACD (Moving Average Convergence Divergence) and RSI (Relative Strength Index) but takes much of its calculations from Exponential Moving Averages (hence ‘exponential average’).
A triple-smoothed EMA (Exponential Moving Average) is essentially an EMA of an EMA of an EMA. In more technical terms, the TRIX reflects a 1% change in a Moving Average that’s been exponentially smoothed thrice.
Traders familiar with the TRIX prefer the indicator’s smoothness and filtering qualities compared to using an individual or two Moving Averages with other systems. Like most momentum indicators, the main job of the TRIX is gauging momentum where traders discern where it’s increasing or decreasing in value above particular points.
Let’s dive deeper into the TRIX’s construction, advantages and disadvantages, and examples of how you can use it in your trading.
Basic design and functions of the TRIX
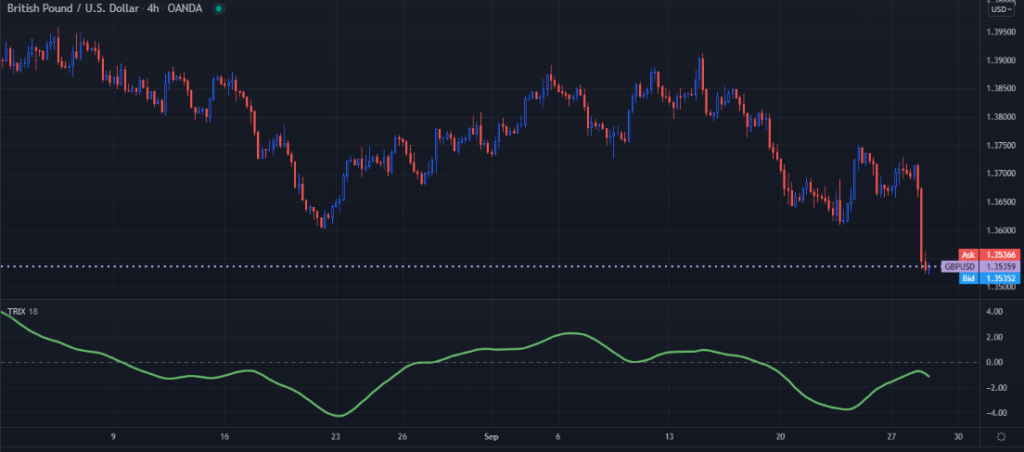
The TRIX looks similar to many oscillators in that it consists of a Moving Average oscillating around a zero line. Though TRIX is slightly different from most oscillators, there are no two extremes reflecting overbought and oversold conditions.
So, generally, traders need discretion in determining where extreme positive numbers suggest strong bullish momentum (overbought) or extreme negative values suggest strong bearish momentum (oversold).
When the TRIX rises above 0, it’s an early sign momentum is rising to the upside; when it dips below 0, it’s an early warning momentum is dipping to the downside.
The second function of the TRIX is for generating buy and sell signals according to how the Moving Average crosses the zero threshold. Like the MACD, when the TRIX moves above 0, it implies a potential bullish trend; conversely, a likely bearish trend is implied when the TRIX moves below 0.
Lastly, no momentum indicator is complete without divergence, something which the TRIX is also capable of showing. We should note other versions of the TRIX exist and vary on different charting platforms based on the smoothing type (simple or exponential) and the addition of a Moving Average.
For instance, on MT4, the TRIX contains an additional Moving Average (referred to as the signal line) on top of the EMA used as a crossover system.
For clarity’s sake, the TRIX being referred to here is from TradingView and aligns with how its original developer designed it. Ultimately, all the versions of the TRIX function in more or less the same way. The default period is typically 18, but this is adjustable based on one’s preferences.
To recap this section, traders use the TRIX for three things:
- Determining overbought and oversold conditions
- Generating buy or sell triggers based on how the Moving Average reacts around the zero line
- Divergence
Examples of using the TRIX indicator
The following charts will reflect the basic functions as discussed previously.
Generating buy or sell triggers
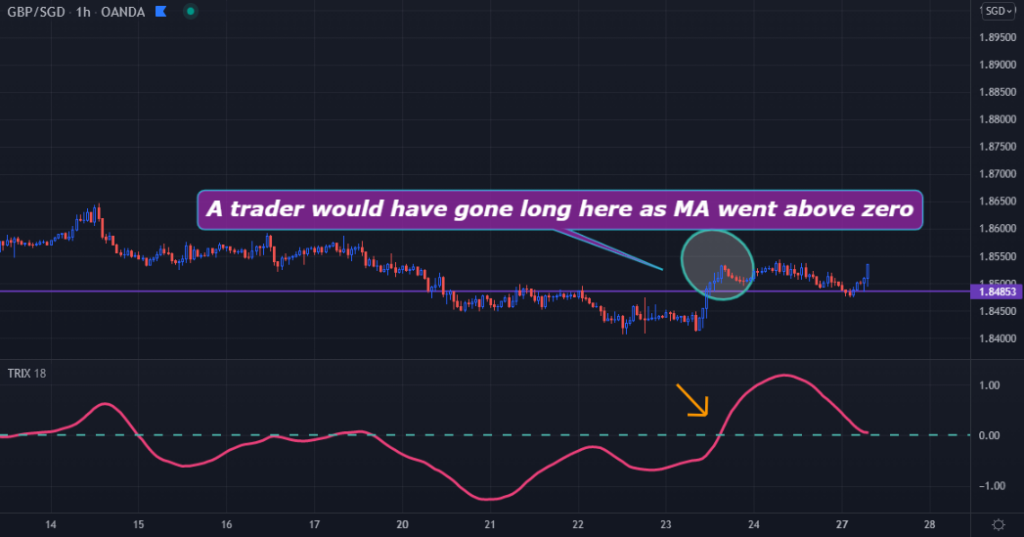
The chart above is an example illustrating how traders could use the TRIX as a buy or sell trigger based on how the Moving Average goes above the zero line. We can see this in action in the image.
For more reliability, traders will want to use these triggers when the Moving Average has stayed for some time below or above the zero level rather than hovering over it as it typically signals stronger momentum.
Of course, traders should not use this entry technique as a standalone. Moreover, it generally works better on lower time-frames to get you in the move earlier than later.
Divergence
Divergence refers to a mismatch between two points when the chart price and indicator do not align.
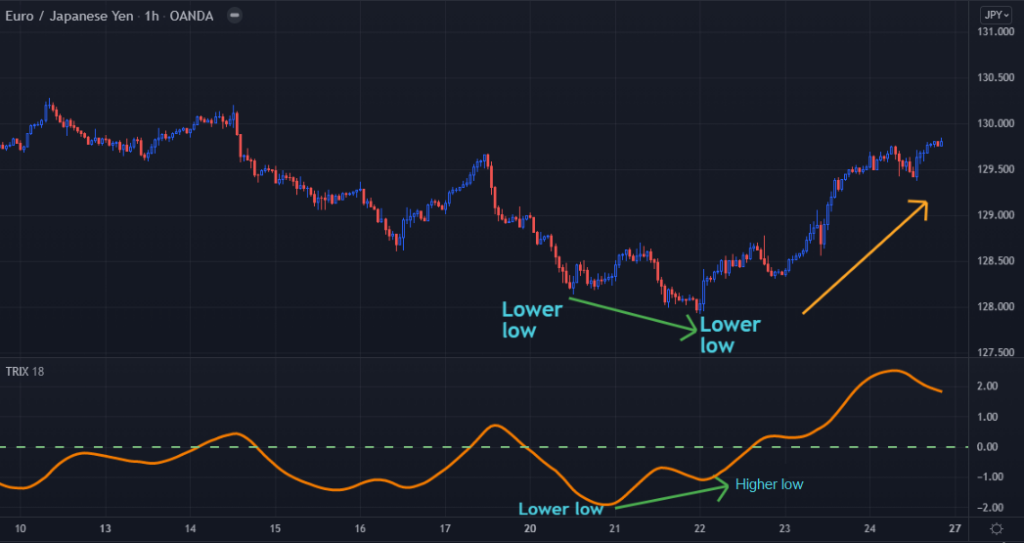
When the market reflects two consecutive lower lows while the TRIX shows a lower low and a higher low, we have a bullish divergence (the opposite is true for bearish divergence).
This event implies a reversal may be on the cards, and the price could change direction. In the EURJPY chart above, we have a classic bullish divergence which caused the market to reverse quite a bit.
Final word
The TRIX combines the best worlds of trend-following and momentum-following indicators. Some traders may primarily be focused on studying the trend without looking at the momentum and vice versa. Therefore, TRIX strikes a perfect balance by incorporating both of these essential elements in its construction.
The triple exponential average formula behind the TRIX shows a smoother reading of the Moving Average, eliminating small short-term cycles that may be whipsaws. One of the pet peeves with the TRIX is there is no standard in determining overbought and oversold, unlike the RSI, where these areas are 30 and 70.
So, traders will need to use something like the RSI to confirm this factor. However, the biggest drawback is present with any technical indicator, which is their heavily lagging nature. Inherently, indicators only show past price data and cannot accurately tell the future.
It becomes imperative for traders not to use an indicator like TRIX in isolation and combine other factors to produce more reliable trading ideas.
Overall, the TRIX indicator is an excellent combination of trend and momentum in one. Like all indicators, it’s crucial to use confluence and context to aid your overall decision-making before pressing that buy or sell button.


